Issue 2: Water is polluted in urban, farming, and forestry areas
This issue explores how the way we live and use our land can result in excess nutrients (like nitrogen), chemicals, disease-causing pathogens, and sediment entering freshwater and causing harm.
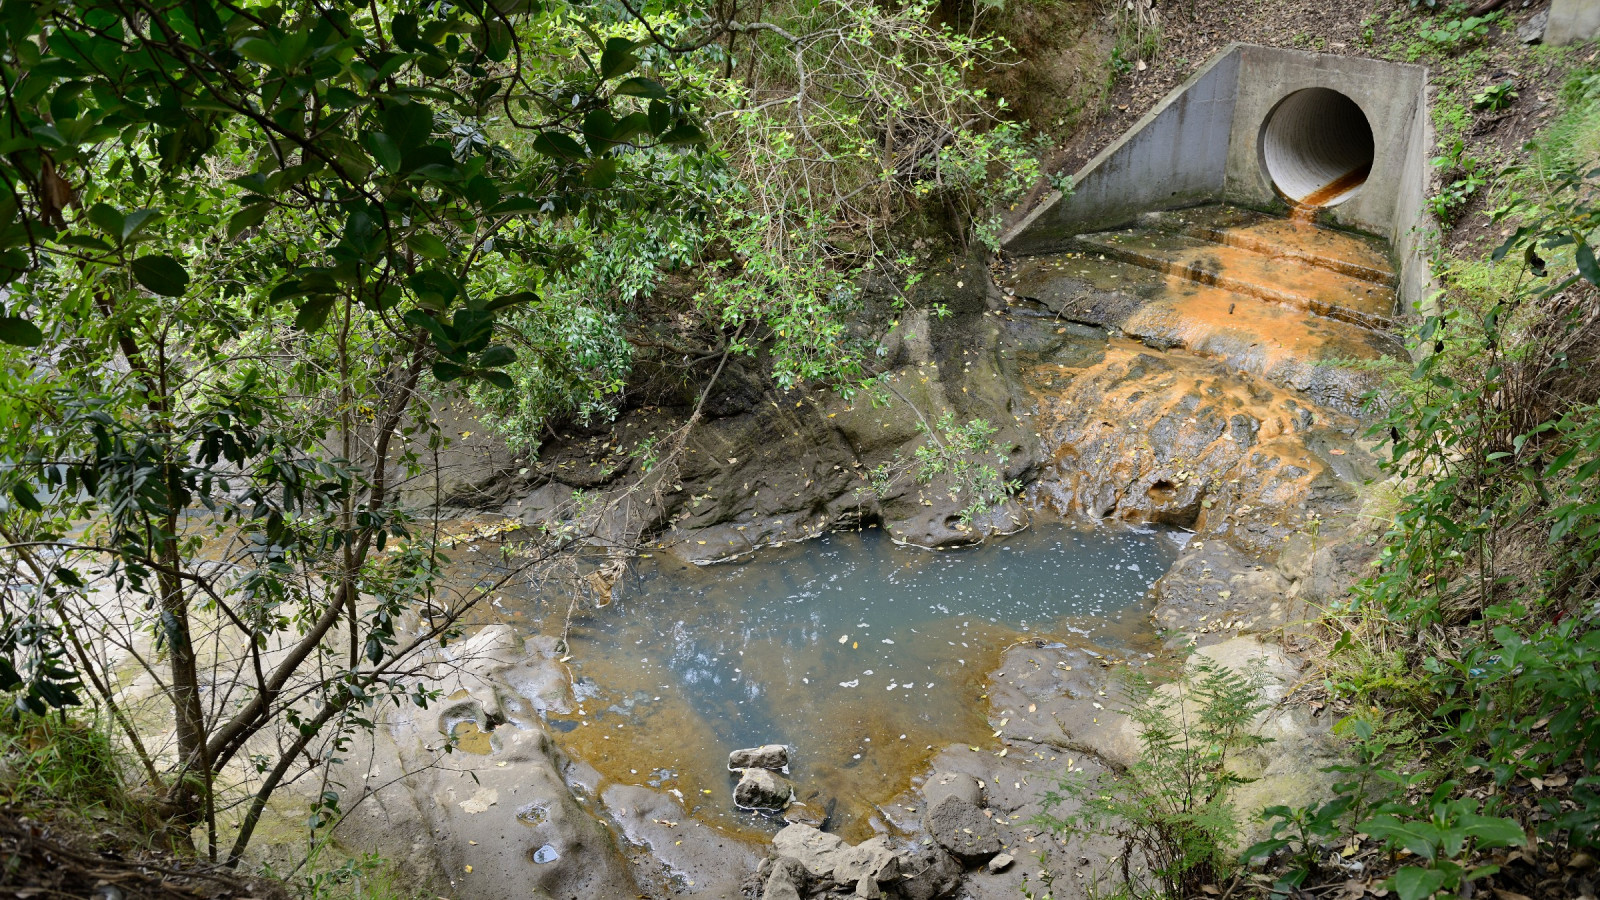
Image: photonewzealand
Many of our rivers, lakes, and groundwaters have unnaturally high levels of nutrients, chemicals, disease-causing pathogens, and sediment. Pollution degrades the health, mauri, and wairua of waterways and can make our water unsafe for drinking, recreation, food gathering, and cultural activities.
Several different types of pollutants affect our freshwater. Nutrients (like nitrogen and phosphorus) can lead to algal blooms that degrade ecosystems and the cultural and recreational value of water. Sediment makes the water cloudy and smothers natural habitats on the bottom and banks of rivers and lakes. Pathogens like Campylobacter can make people ill when they drink or swim in polluted water. Emerging pollutants are non-natural chemicals that we know little about, including their effects on human health and the environment.
Rivers, lakes, wetlands, and groundwater are parts of an interconnected freshwater system, and poor water quality in one part of the system can affect water quality elsewhere within a catchment.
Pollution of our freshwater is not the result of any single land use, but comes from the mosaic of cities, farms, and plantation forests we see in most river catchments. Our activities in these areas support our lifestyles and economy but have required land to be cleared, drained, and modified. These changes and the way we manage our land have caused more pollutants to be discharged into freshwater.
Applying pesticides and fertilisers, increasing the number of cattle per hectare, felling and replanting pine trees, and faulty wastewater and stormwater infrastructure are all examples of activities that contribute to water pollution.
This issue contains updated information since Environment Aotearoa 2019 including new or updated data from these measures and indicators:
Emerging contaminants (including per- and poly-fluoroalkyl substances) and pesticides are discussed in this issue, and the story of the Waiwhetu Stream is included as a local example. In an infographic, īnanga demonstrate the effects of land-based activities and water pollution on a native fish.
The other issues highlighted in this report are also affected by water pollution.
Pollution affects almost all rivers, many aquifers, and some lakes.
Concentrations of pollutants in freshwater are higher in urban, farming, and forestry areas than in natural conditions, sometimes many times higher.
Difficult to reverse because of the scale of the issue and because some catchments respond slowly to interventions. Reducing pollution requires significant investment and changes in behaviour.
Freshwater pollution threatens our native species and habitats and has a high risk to human health and cultural wellbeing, practices, and knowledge.
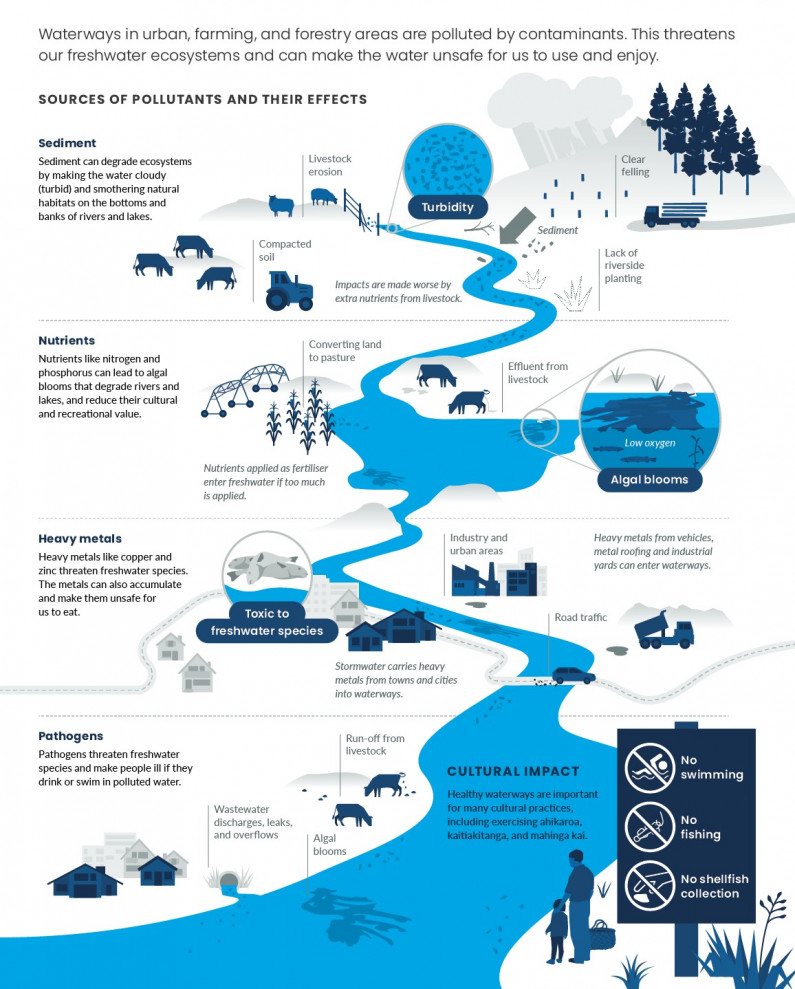
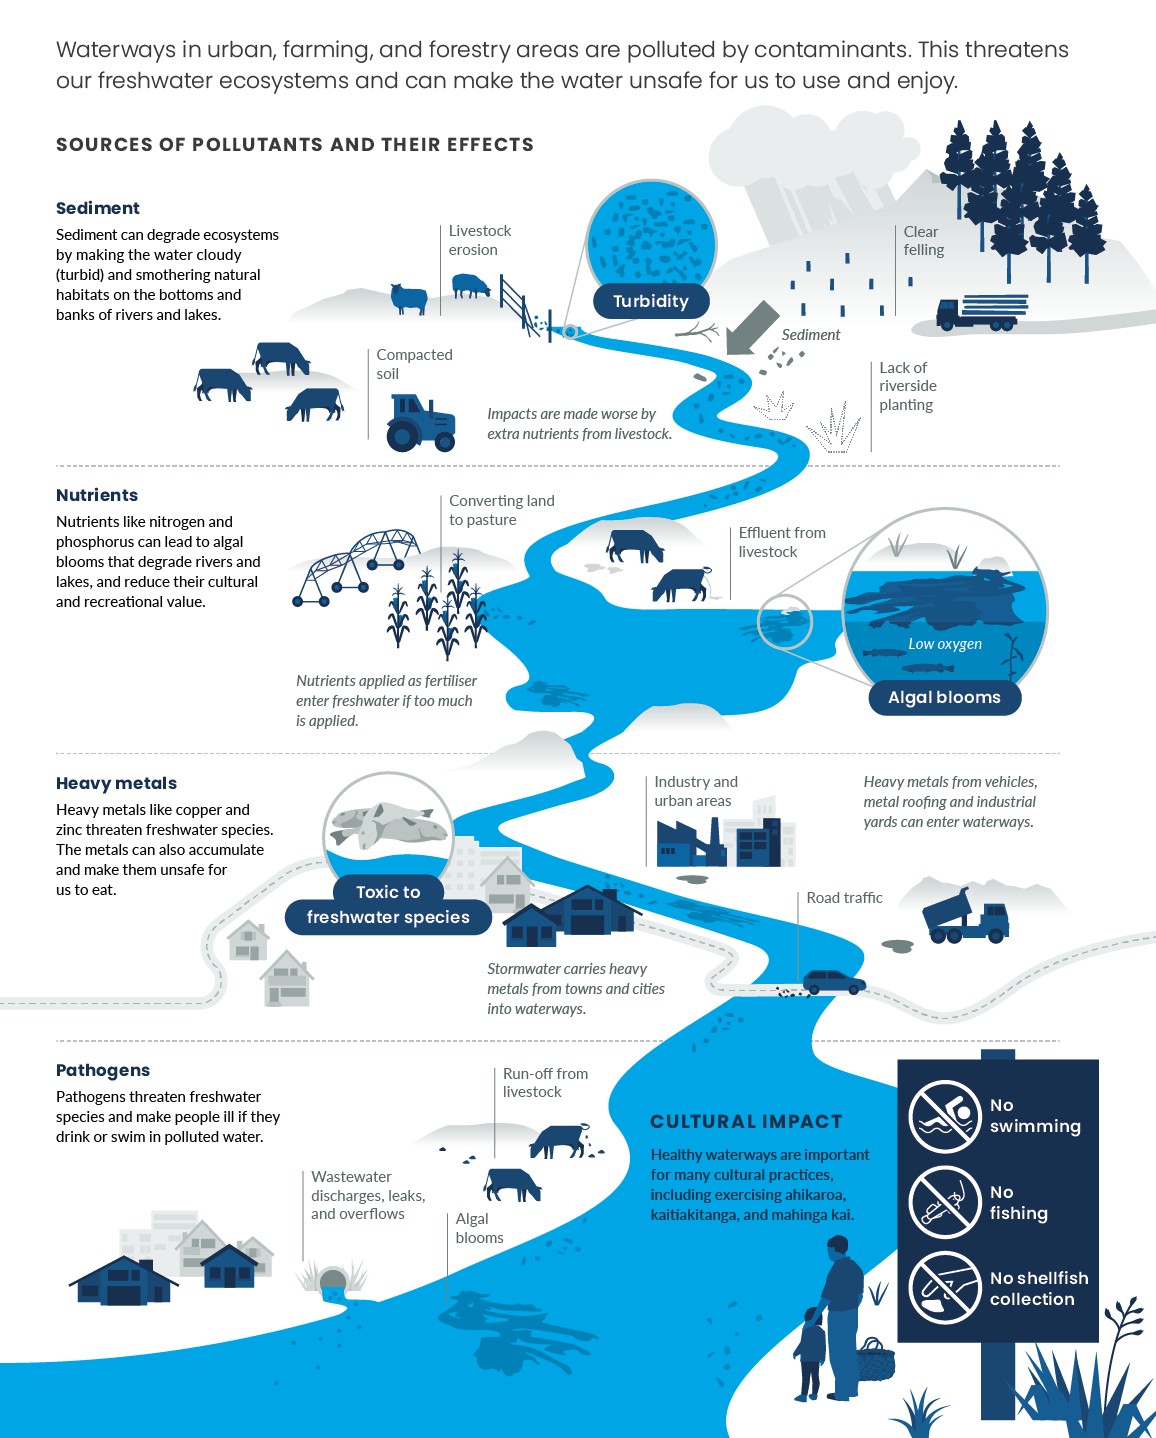
Read the long description for Our activities are polluting the freshwater environment:
Waterways in urban, farming, and forestry areas are polluted by contaminants. This threatens our freshwater ecosystems and can make the water unsafe for us to use and enjoy.
Sources of pollutants are sediment, nutrient, heavy metals, and pathogens.
Sediment can degrade ecosystems by making the water cloudy (turbid) and smothering natural habitats on the bottoms and banks of rivers and lakes.
Nutrients like nitrogen and phosphorus can lead to algal blooms that degrade rivers and lakes, and reduce their cultural and recreational value.
Heavy metals like copper and zinc threaten freshwater species. The metals can also accumulate and make them unsafe for us to eat.
Pathogens threaten freshwater species and make people ill if they drink or swim in polluted water.
Healthy waterways are important for many cultural practise, including exercising ahikaroa, kaitiakitanga, and mahinga kai.
Catchments usually contain a mix of different activities and types of land cover. This report uses land cover to approximate land use and estimate the effects of land use on water quality.
Dominant land cover is estimated based on the best available method, which takes into account that some types of land cover are known to have greater impacts on water quality than others (Snelder & Biggs, 2002).
Catchments are assigned to one of four classes:
Water quality for catchments in the urban, pastoral, and exotic forest land-cover classes is compared between classes, and to catchments in the native landcover class (which are closer to natural conditions).
A very small proportion of catchments are assigned to an ‘other’ land-cover class, and are dominated by gorse, broom, surface mines, dumps, exotic shrubland, or transport infrastructure. This class has been excluded from water quality comparisons.
This report uses two main sets of guidelines and thresholds to assess the state of water quality.
The Australian and New Zealand Guidelines for Fresh and Marine Water Quality (ANZG, 2018) define default guideline values (DGVs) that correspond to the concentrations of the water quality variables that are estimated to occur in natural conditions. The DGVs describe environmental conditions expected in the absence of human influence and focus on ecosystem health. DGVs are not standards that have to be met. Rather, if a DGV is exceeded, this prompts further analysis and monitoring to find out if an aquatic ecosystem has enough protection. DGVs have been defined for river water quality and sedimentation in estuaries, but not for other aspects of water quality in groundwater, lakes, or estuaries.
The National Policy Statement for Freshwater Management (Freshwater NPS) (MfE, 2017a) defines minimum acceptable states for water quality based on ecosystem health and human health. Appendix 2 of the Freshwater NPS defines bands (ranges) for relevant attributes to support these values in rivers and lakes. These bands represent different states, with A being the best state and D or E the worst. This includes setting minimum acceptable states called national bottom lines that councils must meet, or work towards meeting over time. The national bottom line is the boundary between bands C and D.
Appendix 2 of the Freshwater NPS includes bands for the concentrations of Escherichia coli (E. coli) as an indicator of the risk of Campylobacter infection for people swimming in rivers and lakes, and bands for concentrations of phytoplankton, total nitrogen, total phosphorus, and periphyton (the natural growth on rocks and riverbeds) in relation to ecosystem health.
Note that the attribute bands are not directly comparable to the DGVs in the Australian and New Zealand guidelines for fresh and marine water quality (ANZG, 2018).
Most of the rivers in catchments in the urban land-cover class are polluted with nutrients and suspended sediment, and many are polluted with pathogens and heavy metals. River reaches (or sections) in these catchments make up 1 percent of New Zealand’s total river length.
Computer models estimated that for 2013–17, more than 99 percent of the total river length in catchments in the urban land-cover class exceeded one or more default guideline values (DGVs) for nutrients and turbidity (or cloudiness, a measure of suspended fine sediment). The models also estimated that E. coli levels (an indicator of pathogens) for 44 percent of the total river length in these catchments exceeded expected concentrations for natural conditions (McDowell et al, 2013) for the same period (see figure 5).
For river reaches in catchments in the urban land-cover class, the medians of the modelled nitrate-nitrogen and E. coli levels were twice as high as reaches in catchments in the pastoral land-cover class and 23 and 36 times higher respectively than reaches in catchments in the native landcover class.
For river reaches in catchments in the urban land-cover class, the median levels of modelled dissolved reactive phosphorus and turbidity were 39 and 57 percent higher respectively than river reaches in catchments in the pastoral land-cover class, and four and three times higher respectively than river reaches in catchments in the native land-cover class. (See indicators: River water quality: nitrogen, River water quality: phosphorus, River water quality: Escherichia coli, and River water quality: clarity and turbidity.)
Neither measured nor modelled data is available for heavy metals at a national scale, so monitored river water quality data for 2015–17 from sites in Auckland, Wellington, and Christchurch is presented here. Median concentrations of zinc exceeded DGVs at 73 percent of monitored river sites in Auckland, 60 percent of monitored sites in Wellington, and 33 percent of monitored sites in Christchurch. Concentrations of zinc are also likely to be higher at stream sites with greater proportions of urban land in their upstream catchments. For copper, median concentrations exceeded DGVs at 36 percent of monitored sites in Auckland, 20 percent of monitored sites in Wellington and at both monitored sites in Christchurch (see ‘Waiwhetu Stream: the cost of pollution’. (See indicator: River water quality: heavy metals.)
If you are on a mobile device, you can view the graph better on the StatsNZ website.
Many studies at national, regional, and catchment scales show that the concentrations of nitrogen, phosphorus, sediment, and E. coli in rivers all increase as the area of farmland upstream increases (Larned et al, 2018).
Half of New Zealand’s river length is in catchments in the pastoral land-cover class. The dominant land cover in these catchments is horticultural, arable cropping, and exotic grassland (including all dairy, beef, sheep, and other livestock pasture). Most of the rivers in these catchments are polluted with nutrients and suspended sediment, and many are polluted with pathogens. River water quality in farming areas varies by season – places with mostly pastoral land cover typically have higher nutrient concentrations and turbidity in winter than in summer (Whitehead et al, 2019).
Computer models for nutrients and turbidity estimated that 95 percent of the total river length in catchments in the pastoral land-cover class exceeded one or more DGVs for 2013–17. The models also estimated that E. coli levels for 24 percent of the total river length in these catchments exceeded expected concentrations for natural conditions for the same period (see figure 5).
For river reaches in catchments in the pastoral land-cover class, the medians of the modelled nitrate-nitrogen and E. coli levels were 11 and 18 times higher respectively than river reaches in catchments in the native land-cover class. The medians of the modelled dissolved reactive phosphorus and turbidity levels were also three and two times higher respectively than river reaches in catchments in the native land-cover class (see figure 5). (See indicators: River water quality: clarity and turbidity, River water quality: Escherichia coli, River water quality: nitrogen, and River water quality: phosphorus.)
Once crowned with the dubious honour of being the most toxic stream in New Zealand, Waiwhetu Stream was used as an industrial drain for decades. In 2006, its metre-deep layer of sludge contained DDT and E. coli and had levels of copper, zinc, and lead that exceeded environmental guidelines by as much as 90 times.
“The lead content was high enough to mine,” says Te Rira Puketapu, Te Āti Awa elder at Waiwhetu Marae. He recalls how the stream changed colour during the course of a day as the local carpet factory released excess wool dye. “It could be bright yellow then turn blue or any other colour – I don’t know how they got away with it.”
Waiwhetu Stream begins in the Hutt Valley’s eastern hills and passes through residential and industrial areas for 9 kilometres, ending in the Hutt River as it enters Wellington Harbour. It was originally part of a large wetland and river system on the valley floor.
The 1855 Wairarapa earthquake changed the course of the stream but it has also been extensively modified with sections straightened and weirs installed. Nearby land was reclaimed to accommodate growing industries in Seaview and Gracefield. These included a shipyard, railway workshops, and battery, electroplating, car, and biscuit factories.
Complaints about oil and chemical discharges from the railway workshops were common. Oil floating on its surface is said to have caught fire in the 1970s. (It was standard practice to wash out railway containers that had transported oil and chemicals without treating the wastewater.) The stream also flooded after heavy rain and stank – especially at low tide when the banks in the lower reaches were exposed.
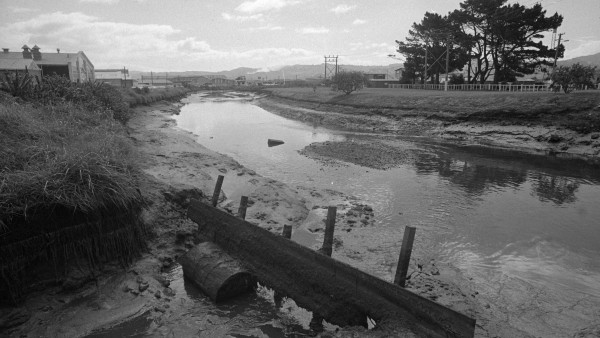
Lower tidal section of the stream in 1975. Photo: Alexander Turnbull Library
But it wasn’t always like that. Puketapu, now in his 80s, recalls spending time as a boy in the stream’s deep swimming holes and pottering about in a tin boat.
“We would regularly catch eels there for the table. We were a family of 10 and after World War II, like many New Zealanders, we found it hard. Like my ancestors, we lived off the stream, eating native trout/kōkopu, freshwater crayfish, watercress, and mussels – and there was plenty. We used to catch whitebait by our marae too.”
Cape pondweed (Aponogeton distachyos) was introduced to the stream about 100 years ago, but became a nuisance after it grew to cover the entire surface. It caused algal blooms in summer, trapped rubbish floating downstream, and made the water muddy. Because it also slowed water movement and contributed to flooding, Greater Wellington Regional Council controlled it by cutting and spraying with herbicide.
The spraying became unpopular with the local community and the weed kept growing back. “When the council applied for a resource consent to continue spraying for another 20 years, our people went to the Environment Court and got it stopped.”
About this time a local care group formed, which later became the Friends of Waiwhetu Stream. The group lobbied to speed up work to improve the health of the stream and tackled many aspects of its restoration, including planting thousands of riverside plants. They manually dug out all 350,000 cape pondweed plants – a mammoth task that took four years and a team of committed community volunteers. Greater Wellington Regional Council and Hutt City Council assisted by disposing of the plants and rubbish.
Waiwhetu Stream near Riverside Drive today showing well-established native planting. Photo: Merilyn Merrett
After years in the planning, Greater Wellington led a project to address the flooding and toxic sediment in the lower reaches. This project began in 2010 and was funded by Greater Wellington, Hutt City Council, and the Ministry for the Environment to the tune of $26 million. About 4,000 truckloads of contaminated sludge was taken to landfill and the stream was widened and deepened.
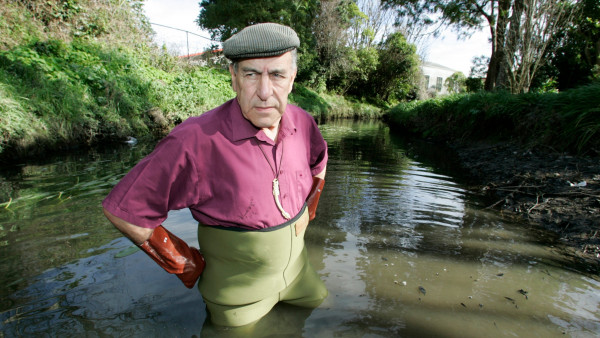
Te Rira Puketapu helping with the cape pondweed removal. Photo: Stuff Limited
“They put in a long concrete wall to contain the stream, apart from beside our urupā there. Our people were involved in case anything was dug out that indicated human remains, but that didn’t happen. Getting rid of the greater part of the contamination has improved the health of the stream and probably the harbour as well.”
Human waste continues to plague the stream, mainly from sewage discharges after heavy rain when the wastewater system is overloaded. Improvements have included pipe repairs and upgrades, as well as the installation of large holding tanks. Since more than half of Lower Hutt’s stormwater ends up in the stream, the risk of it carrying contaminants and rubbish from roads, homes, and industrial areas is also high.
All these efforts have encouraged life back into Waiwhetu Stream and its so-named starry waters are beginning to sparkle once more. It is a popular place to walk and play, and murals and sculptures (including one carved from granite rollers that once crushed coconut at the biscuit factory) tell local history as part of an arts and sculpture trail along the stream. Surveys show that fish, eels, and kōura are present, and there have been community sightings of larger marine creatures in the estuarine areas.
“It’s better, but it will never get back to how it was. We can’t have our children swimming there. It’s really a sad story.” Puketapu also has fears for the future. “With climate change bringing more sunshine and hotter summers, the algae is getting worse, and for the first time in my life I’ve seen the upper reaches of the stream dry up completely.”
The water quality in catchments in the exotic forest landcover class is generally better than in catchments in the urban and pastoral land-cover classes. However, most rivers in catchments in the exotic forest land-cover class are polluted with nutrients and many are polluted with suspended sediment.
Six percent of New Zealand’s river length is in catchments in the exotic forest land-cover class. Computer models for nutrients estimate that 95 percent of the river length in these catchments exceeded one or more DGVs for 2013–17. The models also estimated that 27 percent of the total river length in these catchments exceeded the DGV for turbidity for the same period (see figure 5).
(See indicators: River water quality: nitrogen, River water quality: phosphorus, and River water quality: clarity and turbidity.)
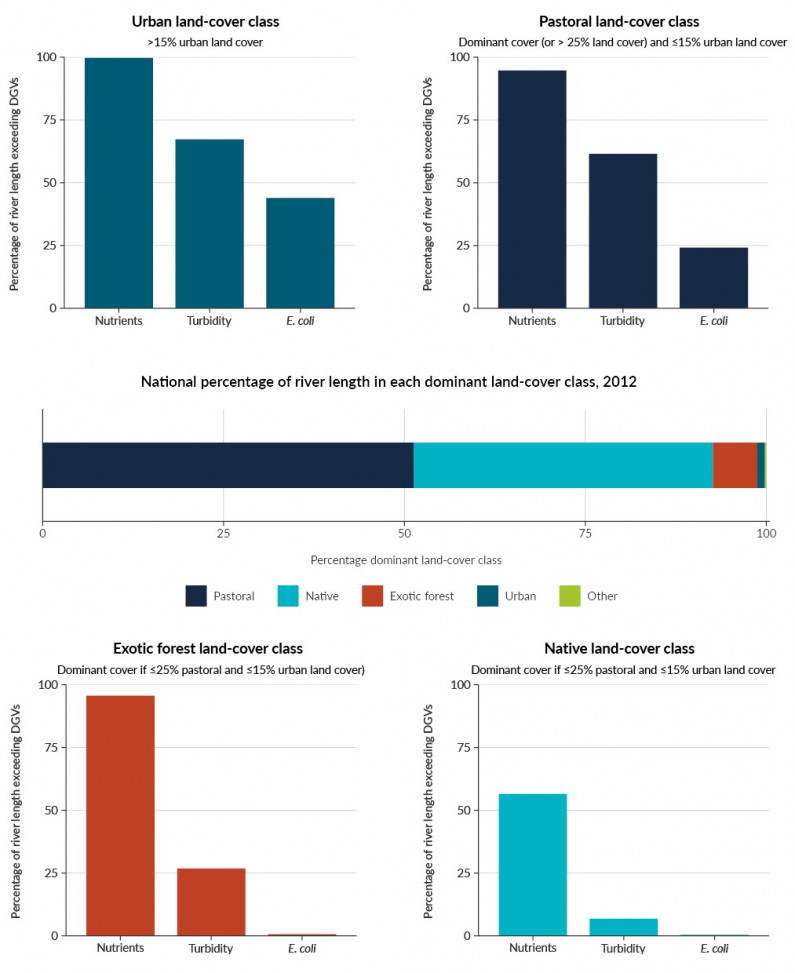
Image: NIWA (Data source)
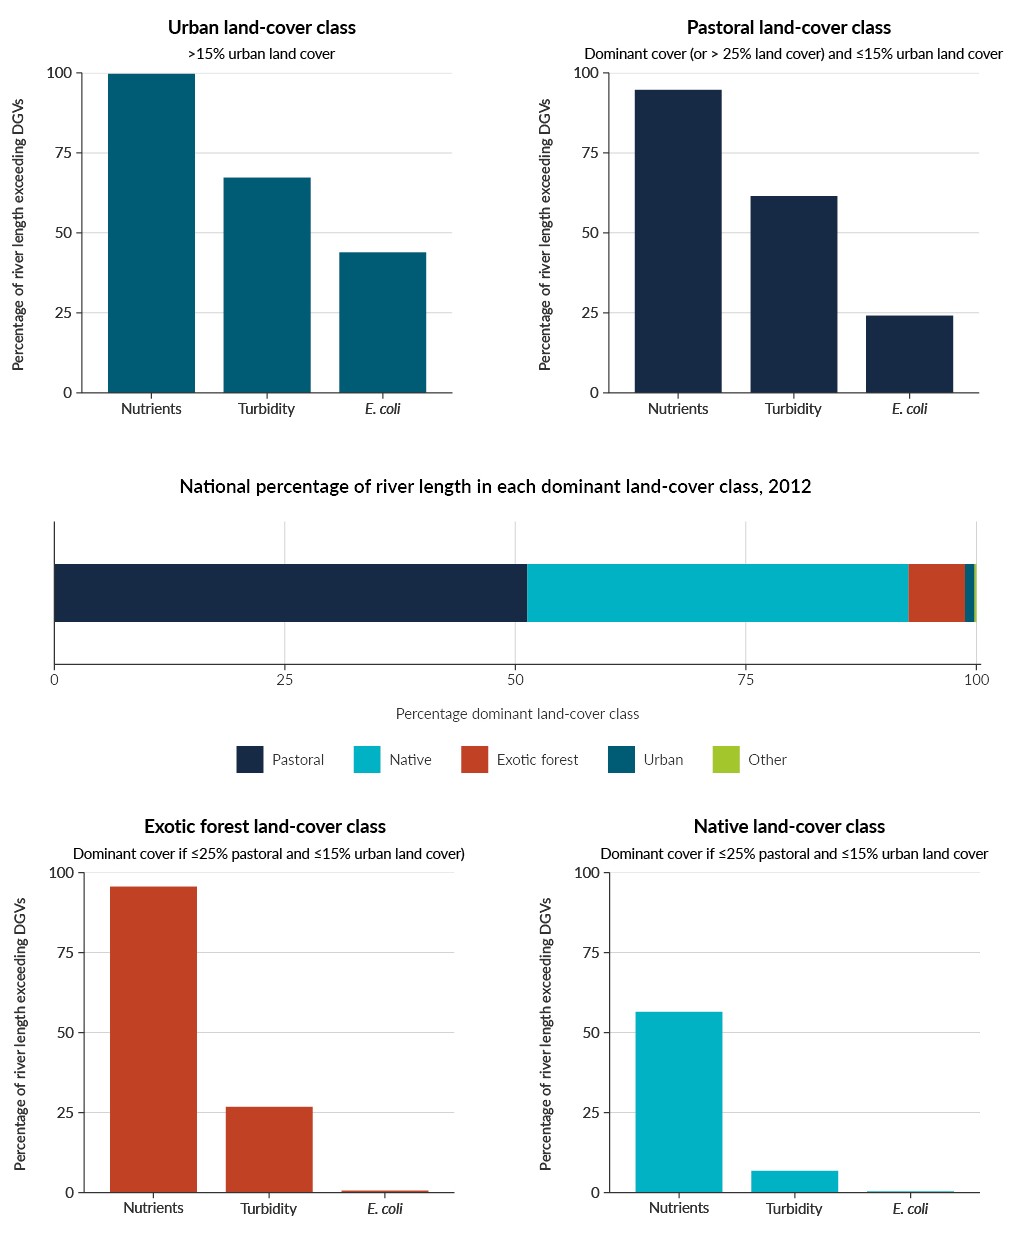
Image: NIWA (Data source)
Read the long description for figure 5
Five graphs in total.
Overall river quality trends for nutrients (nitrate-nitrogen, ammoniacal nitrogen, and dissolved reactive phosphorus), E. coli, and turbidity are mixed. Improving water quality trends were found at slightly more monitoring sites than worsening trends in the 10 years from 2008 to 2017. The trends that can be determined for this period, by land-cover class include (see figure 6):
Trends for different water pollutants varied across the country:
(See indicators: River water quality: clarity and turbidity, River water quality: Escherichia coli, River water quality: nitrogen, and River water quality: phosphorus.)
Understanding the causes of these trends is difficult because of the complexity of freshwater systems. River catchments contain a range of interconnected water reservoirs (including groundwater), and water moves between them at different rates. This results in varying times before changes in water quality are apparent (lag times). Catchments also contain a mixture of land cover, land uses, and land management practices, which contribute to trends.
In addition, seasonal and longer-term variations in weather and climate can have a significant influence on water quality trends, particularly when these are measured over shorter periods of time. Variability is likely to increase as our climate changes but more research is needed to improve our understanding of how climate variability influences water quality trends (Snelder & Fraser, 2019).
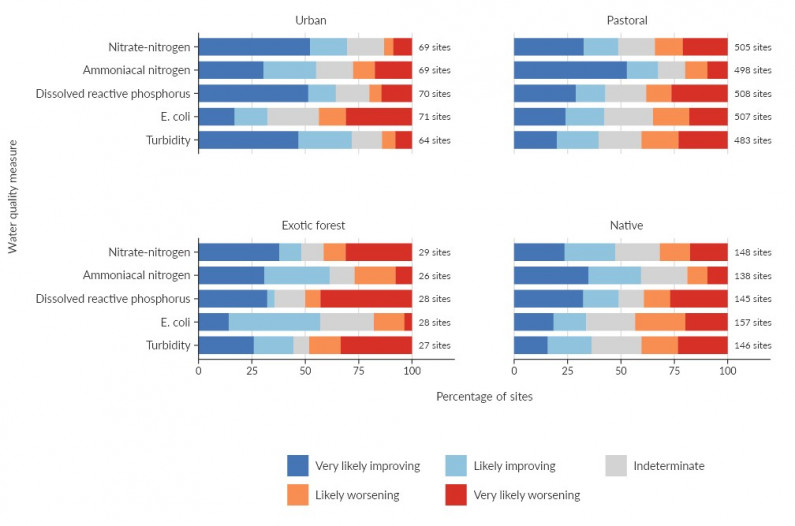
Image: NIWA (Data source)
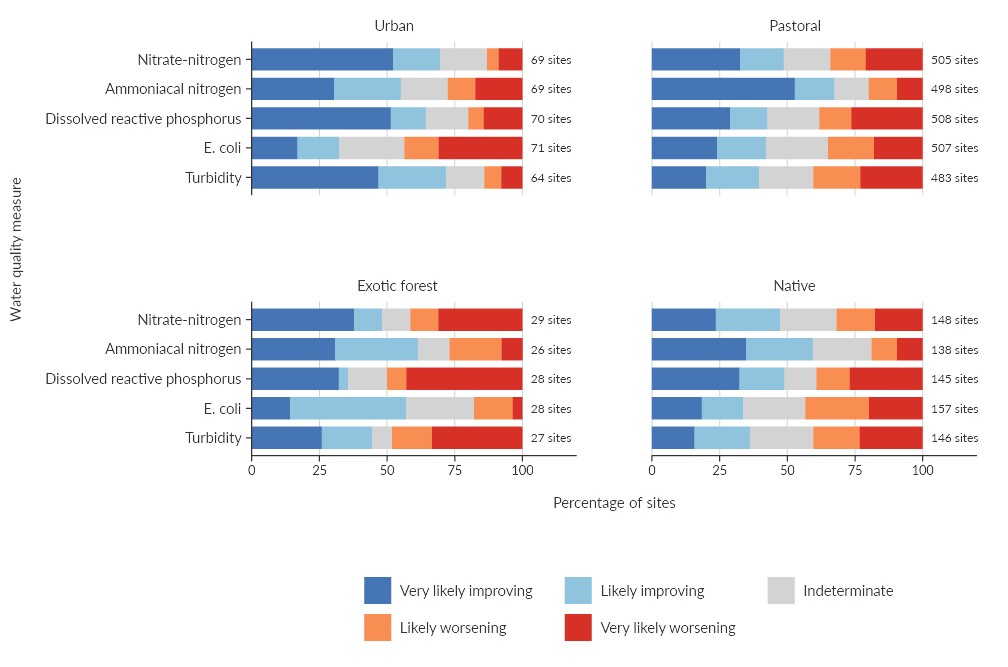
Image: NIWA (Data source)
Read the long description for figure 6
Four graphs showing the percentage of sites for which water quality is ‘very likely improving’, ‘likely improving’, ‘indeterminate’, ‘likely worsening’ or ‘very likely worsening’ in urban, pastoral, exotic forest and native land-cover areas.
About half of New Zealand lakes larger than 1 hectare have upstream catchments in the urban, pastoral or exotic forest land-cover classes. Most of these lakes are polluted with nutrients. Catchments in the native land-cover class are mostly in protected areas like national parks.
Since water quality is monitored in a very small proportion of our lakes, computer models are used to estimate water quality in 3,802 of the 3,820 lakes that are larger than 1 hectare (Schallenberg et al, 2013). The models estimate that total nitrogen concentrations in 28 percent of the lakes with upstream catchments in the pastoral land-cover class exceed the Freshwater NPS national bottom line – 47 percent of lakes larger than 1 hectare have upstream catchments in this land-cover class.
Lakes with upstream catchments in the urban landcover class are available to the highest proportion of New Zealanders. For the 2 percent of lakes with upstream catchments in this land-cover class, models estimate that 44 percent exceed the national bottom line for total nitrogen concentration. Only 19 percent of lakes with upstream catchments in the exotic forest land-cover class and 8 percent of lakes with upstream catchments in the native land-cover class have modelled total nitrogen concentrations that exceed the national bottom line.
The models also estimate that 77, 70, and 67 percent of lakes with upstream catchments in the urban, pastoral, and exotic forest land-cover classes respectively are in poor or very poor ecological health, due to frequent algal blooms and murky water caused by high nutrient concentrations. By comparison, the models estimate that 19 percent of the lakes with upstream catchments in the native landcover class (which can contain up to 15 percent urban and up to 25 percent pastoral land cover) are in poor or very poor ecological health (see figure 7, see The health of our freshwater ecosystems is variable). (See indicator: Modelled lake water quality.)
Trends in lake water quality (either nationally or specific to land-cover classes) cannot be reported due to insufficient monitoring data.
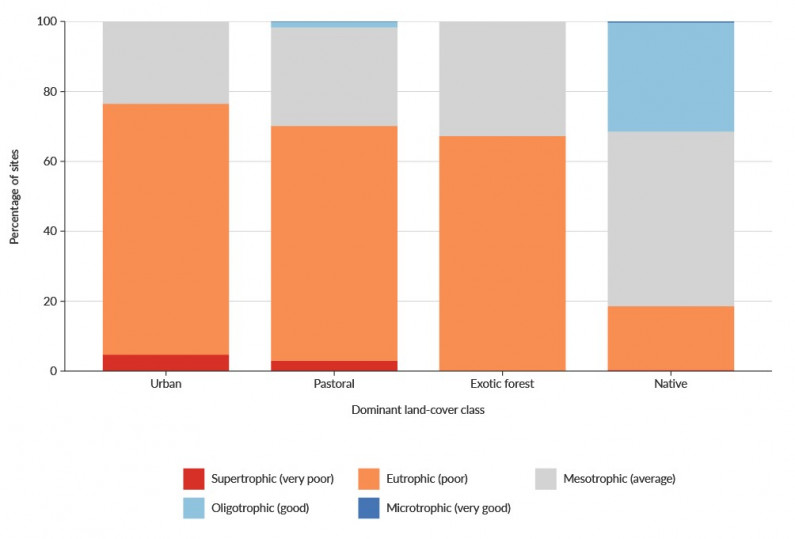
Image: LAWA (Data source)
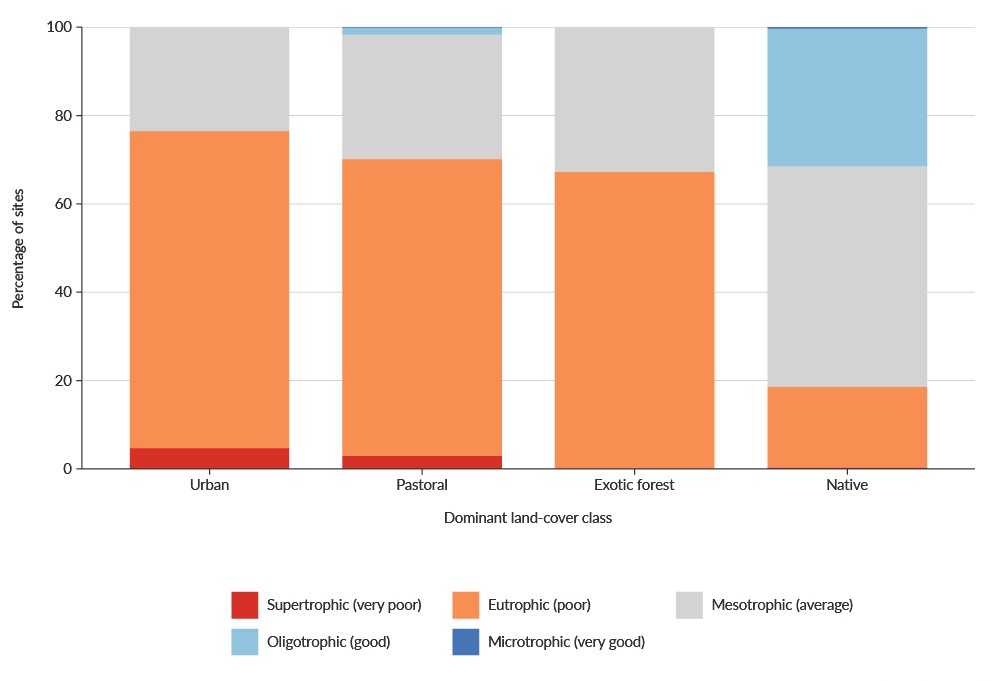
Image: LAWA (Data source)
Read the description for figure 7
Bar graph showing percentage of sites which are ‘supertrophic (very poor)’, ‘eutrophic (poor)’, ‘mesotrophic (average)’, ‘oligotrophic (good)’ or ‘microtrophic (very good)’ for urban, pastoral, exotic forest and native land-cover classes.
The quality of groundwater varies across New Zealand. For 2014–18, 44 percent of 424 monitored sites across the country had median nitrate-nitrogen concentrations that indicate that groundwater in these locations has been influenced by industrialised agriculture and is highly likely to have been impacted by human activity (Morgenstern & Daughney, 2012; Daughney & Reeves, 2005). The natural concentrations expected for other groundwater contaminants (like phosphorus or E. coli) have not yet been defined.
For nitrate-nitrogen, ammoniacal nitrogen, and dissolved reactive phosphorus, 49, 55, and 60 percent of sites respectively had improving trends and 38, 28, and 28 percent of sites respectively had worsening trends for 2009–18. For E. coli, 18 percent of sites had improving trends and 50 percent of sites had worsening trends for the same period.
Groundwater quality monitoring sites are not categorised according to land cover, so the specific effects of land use on groundwater quality cannot be estimated. (See indicator: Groundwater quality.)
If you are on a mobile device, you can view the graph better on the StatsNZ website.
Emerging contaminants are being found more often in New Zealand but are not yet monitored routinely (Close & Humphries, 2019; Moreau et al, 2019; Stewart et al, 2016). In a national survey of 29 different emerging contaminants in groundwater, the plasticiser bisphenol-A, active ingredients of sunscreen, and sucralose (an artificial sweetener) were detected most often, but all were at low concentrations (Close & Humphries, 2019).
A survey of 723 emerging contaminants in groundwater at 51 sites in Waikato found at least one type of emerging contaminant at 91 percent of the sites. Pesticides, pharmaceuticals, industrial waste, and food additives were the most common (Moreau et al, 2019).
PFAS (per- and poly-fluoroalkyl substances) have been found at low concentrations in groundwater and streams below several sites where fire-fighting foam containing PFAS were used in the past (see ‘Emerging contaminants’ box) (Conway & Perwick, 2018; Walker & Callander, 2018).
The term ‘emerging contaminants’ is used for non-natural chemicals in the environment when we know little about them or their effects on human health and the environment. More than 950 different compounds are classified as potential emerging contaminants and include pharmaceuticals, cleaning products, pesticides, animal and personal care product additives (like shampoo preservatives), and industrial compounds such as flame retardants (NORMAN Network, 2016). Some have been in the environment for a long time.
The New Zealand drinking water standards do not specify health limits for these compounds. Ecological guidelines are in place for a small range of emerging contaminants to manage their potential effects on ecosystems.
PFAS (per- and poly-fluoroalkyl substances) are a group of more than 3,000 compounds that have been used in homes and industries since the 1950s for food packaging, non-stick cookware, and in water-resistant products. PFAS can remain in the environment for many decades and accumulate in plants and animals. They are now common contaminants in soil and water and were identified as an environmental concern in the 1990s.
Pesticides have been used in New Zealand for many decades over large areas of land (Manktelow et al, 2005; Chapman, 2010; Rolando et al, 2016). Many pesticides (which include insecticides, herbicides, and fungicides) stay in the environment for long periods and can enter waterways.
Nationwide, groundwater has been surveyed for pesticides every four years since 1990. The 2018 survey detected at least one type of pesticide in 24 percent of the wells tested but at levels that posed no significant risk to human health. Herbicides were found most often, with 17 different compounds detected (Close & Humphries, 2019).
A 2017–18 survey of 36 agricultural streams found several pesticides at most sites, but no comprehensive survey of pesticides in our rivers and lakes has been undertaken (Hageman et al, 2019).
Wastewater, which includes sewage, comes from drains in houses, businesses, and industrial processes and must be treated before it can be released into freshwater. Most wastewater is treated by the 321 publicly-owned wastewater treatment plants in New Zealand (DIA, 2018). Almost half (47 percent) of wastewater treatment plants discharge treated wastewater to rivers and lakes, while the remainder discharge it into the sea or onto land.
Septic tanks are used to partially treat domestic wastewater in many suburbs and towns. They discharge partially treated wastewater underground where it can reach shallow lakes, rivers, or groundwater (see figure 8).
Wastewater treatment is not standardised across New Zealand and the performance of septic tanks is variable, so the quality of treated water is likely to vary. Also, not all contaminants are removed by treatment. Treated wastewater may contain pollutants (like medicines and microplastics) that contaminate land, waterways, and groundwater when it is released (see figure 8) (Petrie et al, 2015; Blair et al, 2017; OECD, 2019).
Stormwater is rainwater that comes off solid surfaces like roofs, roads, and asphalt and is piped into waterways or the sea. It is almost always collected separately from wastewater and is not generally treated. Stormwater can pick up pollutants and carry these into freshwater, and is likely to transport more pollutants if more of the land in a catchment is covered by solid surfaces. Heavy metals are one example that come from vehicles (copper from brake pads and zinc from tyres), metal roofing, and industrial yards (Gluckman et al, 2017; Kennedy & Sutherland, 2008). Stormwater can also be polluted with nutrients from fertilisers used commercially and in home gardens (Environment Aotearoa 2019), as well as hydrocarbons from exhausts, leaking vehicles, and industrial yards (Kennedy et al, 2016).
Nationally, a quarter of our water, wastewater, and stormwater infrastructure is more than 50 years old, with 10–20 percent of the network estimated to require significant renewal or replacement (LGNZ, 2014). Older treatment infrastructure may be less effective, and older pipes are more likely to be damaged and leak untreated wastewater onto land or into freshwater and groundwater.
Overwhelmed or blocked wastewater networks and septic tanks can back up and overflow. This allows untreated wastewater to flow onto the ground, into the stormwater network, then into waterways. Cross connections between waste and stormwater systems also contribute to freshwater pollution.
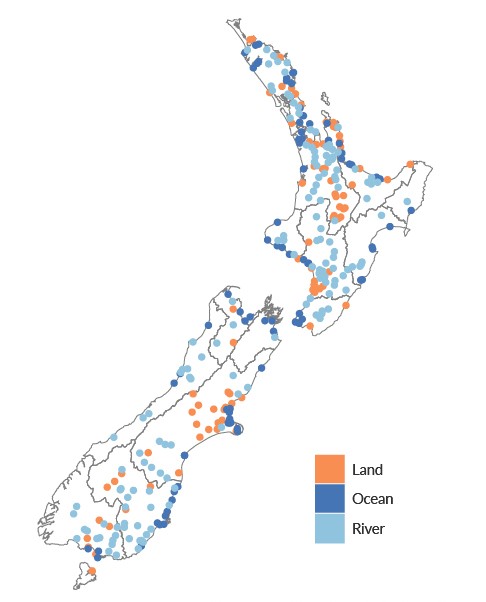
Image: Department of Internal Affairs (Data source)
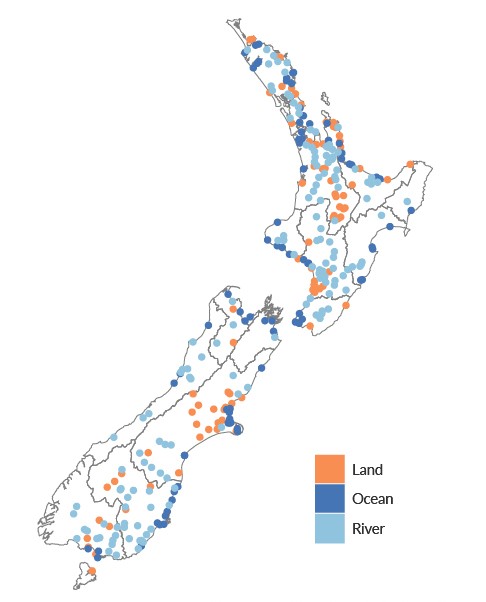
Image: Department of Internal Affairs (Data source)
Establishing cities, towns, and farms in New Zealand involved clearing native forests and scrub, and draining wetlands. These large-scale changes dramatically affected how our soils and water function. Removing or replacing native forest, scrub, and wetlands with pasture or solid surfaces results in higher run-off volumes and flows. Dense vegetation and wetlands slow water down so it can soak into the ground and be absorbed by plants – this helps to prevent flooding and to capture sediment and other contaminants before they reach rivers and lakes (Tomscha et al, 2019; Mackay, 2008).
With less native land cover in their catchments, streams in urban and pastoral areas receive more sediment from run-off, particularly when vegetation beside rivers and streams has been removed. Run-off from pasture may also be a risk when grazing animals compact the soil or damage stream banks, channels, and riparian areas (McDowell et al, 2003).
Farm animals are a source of freshwater pollutants (dissolved nitrogen, phosphorus, and pathogens). Fertiliser and animal dung and urine are important sources of phosphorus (Selbie et al, 2013). A 2012 study showed that the high concentration of urine in spots on pastures was a major source of dissolved nitrogen (Parfitt et al, 2012). Another 2012 study showed that livestock dung also made a major contribution to the faecal contamination of waterways in the farming areas studied (Cornelison et al, 2012).
Once they are established, plantation forests stabilise the soil and reduce erosion, particularly on steep land. When the trees are being cut down and replanted, however, forestry can cause sediment and nutrients to enter waterways (Julian et al, 2017). Clear felling (the method used to harvest forests in New Zealand) exposes and disturbs soil, including from the construction of roads used for vehicle access during harvesting. This increases erosion and the sediment in rivers and lakes (Environment Aotearoa 2019).
Clear felling in some Nelson catchments caused a five-fold increase in the rate of soil loss to nearby waterways. In a Hawke’s Bay catchment, an eight-fold increase has been documented. The higher rates of soil loss typically returned to pre-harvest levels or declined markedly within 2–3 years of harvest (Basher et al, 2011; Baillie & Neary, 2015; Fahey & Marden, 2006).
The concentrations of nitrogen and phosphorus in nearby waterways can also increase during harvesting and when fertiliser is applied during replanting (Julian et al, 2017).
From 1994 to 2017, the number of dairy cattle in New Zealand increased by 70 percent (from 3.8 million to 6.5 million). During the same period, the number of sheep decreased by 44 percent from 49.5 million to 27.5 million, and the number of beef cattle decreased by 28 percent from 5 million to 3.6 million. The increase in dairy cattle has been most pronounced in the South Island (see figure 9), notably in Canterbury, Otago, and Southland.
The area of land used for dairy farming has also increased. In 2016, 2.6 million hectares was used for dairy production (a 42 percent increase from 2002), while the area used for sheep and beef farming was 8.5 million hectares (a 20 percent drop in the same time). (See indicator: Agricultural and horticultural land use.)
This shift from sheep and beef farming to dairy farming is associated with increased leaching of nitrogen from agricultural soils. Leaching occurs when the concentration of nitrogen in the soil (from animal urine and fertiliser) is greater than the amount that soil and plants can absorb.
Models of the total amount of nitrate-nitrogen leached from livestock show an increase nationwide from 189,000 tonnes per year in 1990 to about 200,000 tonnes per year in 2017. The amount of leaching in specific places has also changed as a result of shifts in the number and type of livestock. According to the model, the highest nitratenitrogen leaching from livestock in 2017 occurred in Waikato, Manawatū-Whanganui, Taranaki, and Canterbury (see figure 10).
The model also shows that dairy cattle make a proportionally higher contribution to nitrogen leached from agricultural soils than other types of livestock. Cattle excrete more nitrogen per animal than sheep (as cows produce more urine, which has a higher nitrogen concentration), so nitrogen from cattle is more likely to leach through soil than nitrogen from sheep (MfE, 2018a; Pacheco et al, 2018).
Nationally in 1990, 39 percent of modelled nitrate-nitrogen leaching came from dairy cattle, 26 percent from beef cattle, and 34 percent from sheep. By 2017, dairy cattle contributed 65 percent of the modelled leached nitratenitrogen, with 19 percent from beef cattle, and 15 percent from sheep. (See indicator: Nitrate leaching from livestock.)
A 2005 study estimated that nationally, 37 percent of the nitrogen load entering the sea came from dairy farming despite dairy farming occurring on less than 7 percent of our land at that time (Elliot et al, 2005).
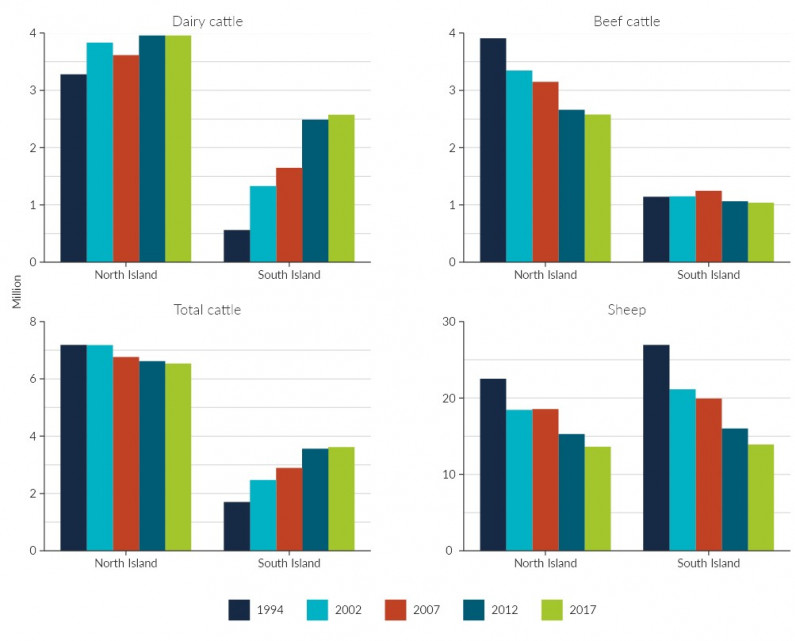
Image: Stats NZ (Data source)
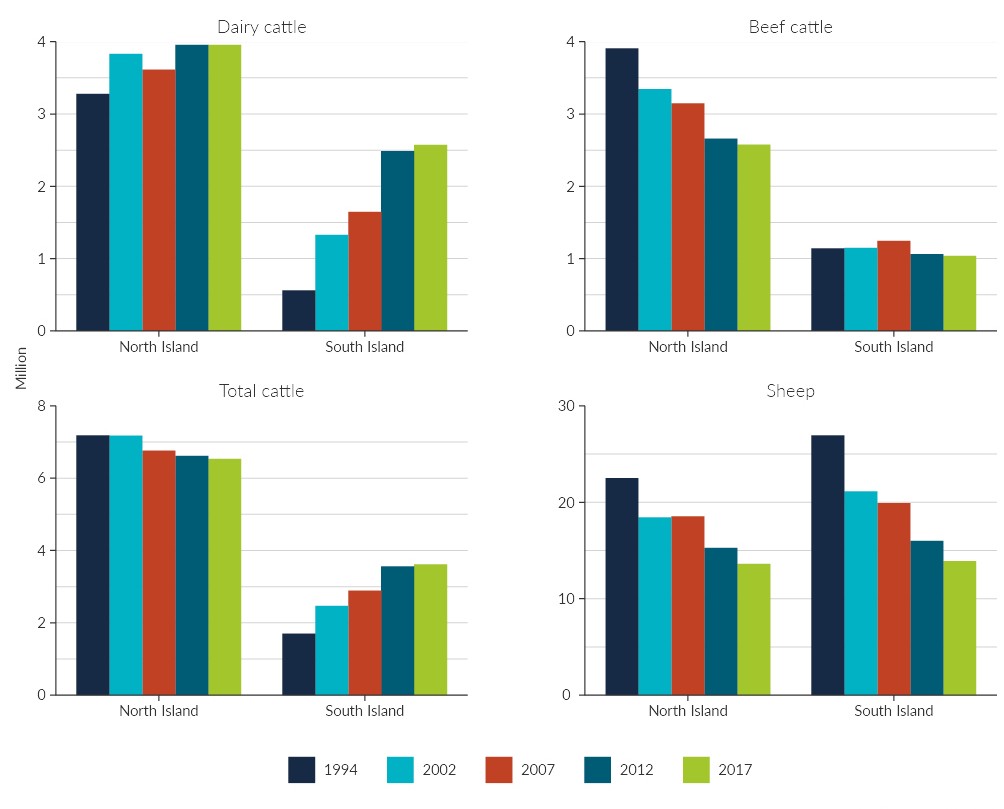
Image: Stats NZ (Data source)
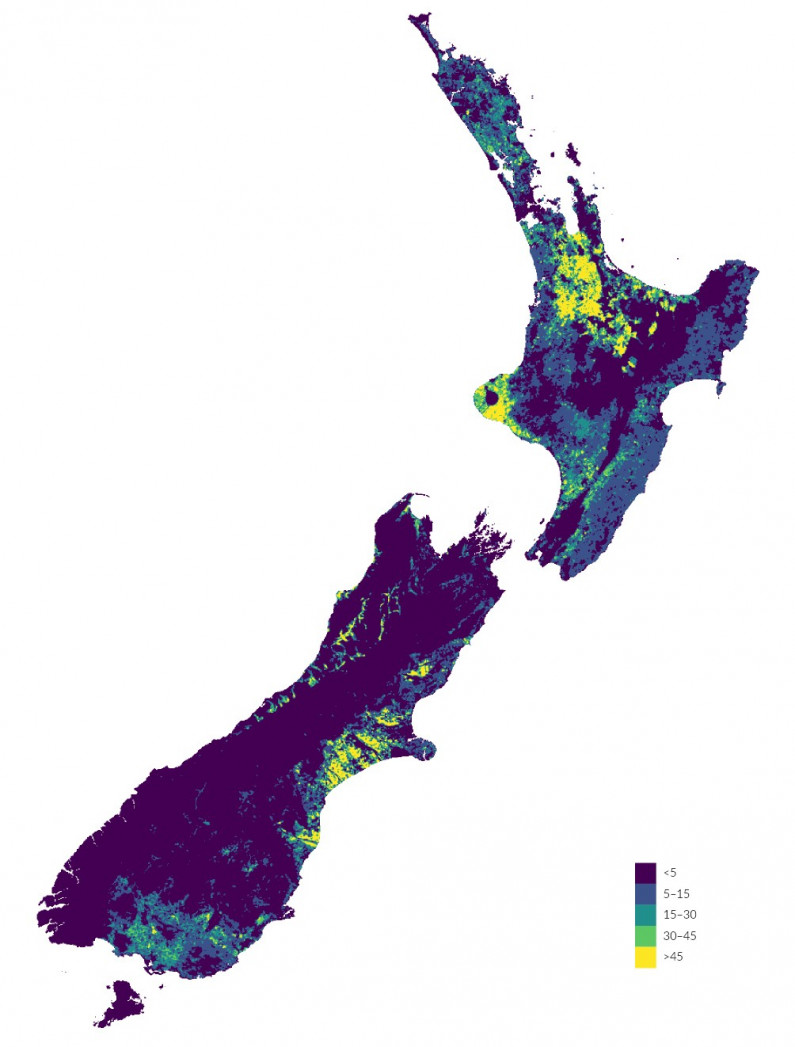
Image: Manaaki Whenua - Landcare Research (Data source)
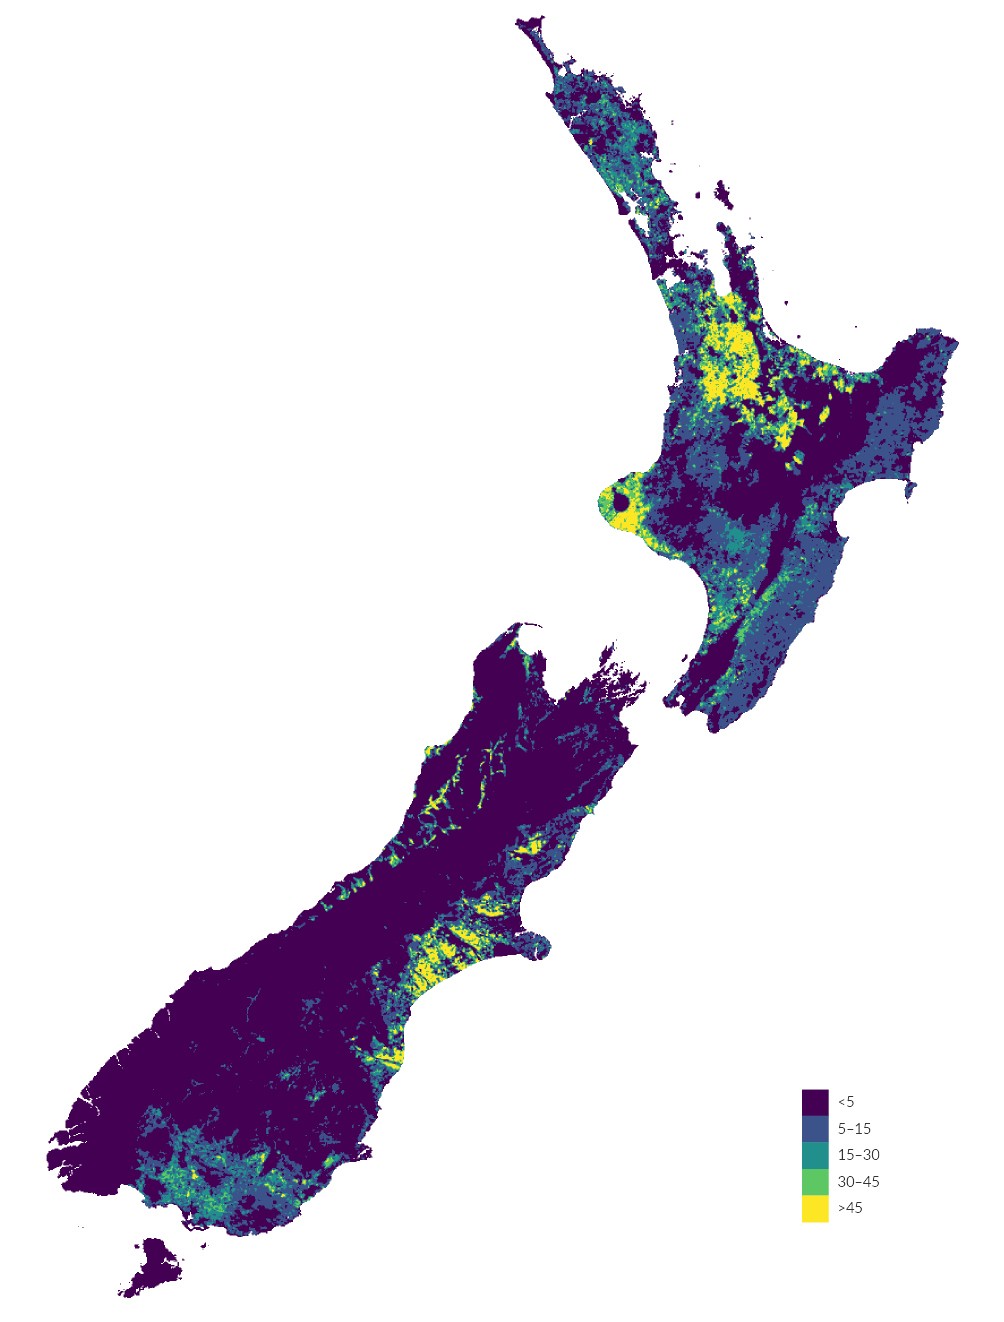
Image: Manaaki Whenua - Landcare Research (Data source)
The number of cattle per hectare increased in some parts of the country between 1994 and 2017. (See indicator: Livestock numbers.) More animals per paddock can increase the amount of nitrogen released into the environment (Julian et al, 2017). When animals are closer together, urine patches are more frequent and overlap, and a greater likelihood that the absorption of nitrogen by soil and plants will be overloaded (Ledgard, 2013).
High animal stocking rates can compact the ground, particularly when the soil is wet (Drewry et al, 2008). Compaction closes up the small air spaces in the soil and reduces the drainage and leaching of nitrogen from the soil. Nitrogen on the surface of the soil can contribute to greenhouse gas emissions (as nitrous oxide) more easily (van der Weerden et al, 2017) or be washed directly into waterways.
Also, the use of nitrogen fertiliser has increased. The amount of nitrogen applied in fertiliser has increased more than six-fold since 1990, from 59,000 tonnes in 1990 to 429,000 tonnes in 2015. The amount of phosphorus applied as fertiliser peaked at 219,000 tonnes per year in 2005 but has reduced to about 150,000 tonnes per year in the last decade (155,000 tonnes in 2015). (See indicator: Fertilisers – nitrogen and phosphorus.)
Pesticides have been used to control unwanted organisms in agricultural, forestry, conservation areas, and in our homes and gardens for many years. In 2005, the farming and forestry sectors used the most herbicides and the horticultural sector used the most fungicides and insecticides as measured by volume (Manktelow et al, 2005).
From 1990 (when data on the quantity of pesticide imports was first available) to 2009, our annual imports of pesticides, herbicides, and fungicides for agricultural use increased by nearly 70 percent. During the same period, the total annual application of pesticides per unit area of agricultural land increased from 1.3 to 9.4 kilogrammes per hectare. From 2009 to 2017 pesticide imports remained stable and were applied at 7.6–9.4 kilogrammes per hectare annually (FAO, nd, see figure 11).
The negative environmental effects of pesticides are relatively well known (Champeau & Tremblay, 2013), and such a large increase in the use of pesticides for agriculture is likely to have led to more of these chemicals reaching the freshwater environment. However, no data confirms this. Although pesticide use has increased, there has been a shift to the use of less toxic chemicals and more responsible application practices, particularly in the horticultural sector (Mankelow et al, 2005).
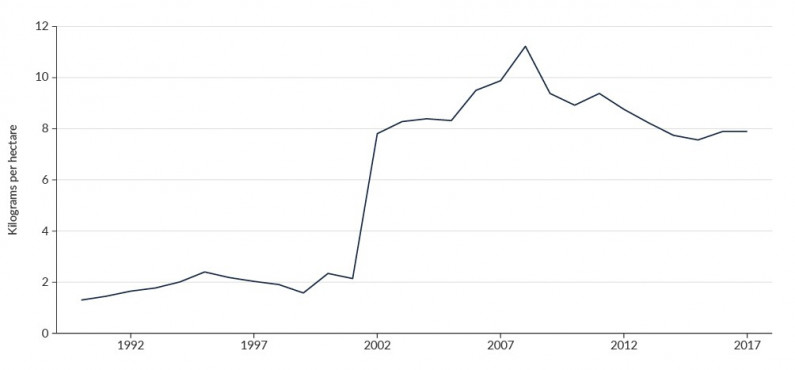
Image: FAO (Data source)
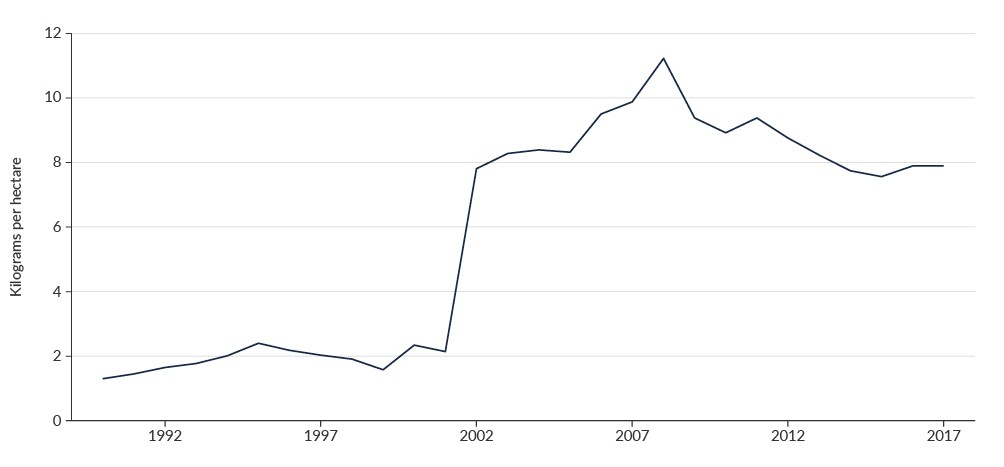
Image: FAO (Data source)
As their concentrations increase, nutrients begin to affect whole ecosystems. Nutrients cause harmful algal blooms that deplete the water’s dissolved oxygen. Dissolved oxygen is essential for healthy ecosystems and fish need it to breathe. Some fish, particularly the young of species like īnanga, rainbow trout, common smelt, and common bullies are more sensitive to low levels of dissolved oxygen than others (Franklin, 2014; Landman et al, 2005). Īnanga are not good at detecting and avoiding water that contains ammonia at levels that could be toxic to them (Richardson et al, 2001).
At very high concentrations, nitrate-nitrogen and ammonia become toxic to freshwater species. Such conditions would rarely pose a risk because high nutrient levels would normally have already made the ecosystem unliveable for species through algal blooms and depleted oxygen.
Modelled concentrations of nitrate-nitrogen and ammonia in most rivers in catchments in the urban and pastoral land-cover classes are high enough to present a toxicity risk to freshwater species (if any were present) based on the National Objectives Framework bands for ecosystem health. (See indicator: River water quality: nitrogen.)
The risk of toxicity from nitrate-nitrogen and ammonia in groundwater ecosystems cannot be accurately assessed because the effects of excess nutrients are not well known in those systems, but it is assumed they would have a similar risk to surface water ecosystems (such as rivers and lakes) (Fenwick et al, 2018).
Regional councils monitor popular swimming sites, including rivers, lakes, and coastal areas to assess the health risk of swimming at that site (see LAWA website). Faecal contamination from humans and animals is the main reason that swimming can become unsafe.
To manage the different health risks of faecal contamination from various sources, several regional councils have begun tracking and analysing the contamination using DNA and other methods to find its source. Results from Northland Regional Council, Gisborne District Council, and Christchurch City Council showed that it came from geese, swans, seagulls, dogs, cows, and sheep, as well as humans (Gilpin et al, 2011; Reed, 2011; Moriarty & Gilpin, 2009).
Communities of algae and cyanobacteria (photosynthesising bacteria) occur naturally in rivers and lakes. Algal and cyanobacterial blooms occur when the environmental conditions change and allow these microorganisms to reproduce rapidly. High concentrations of nitrogen and phosphorus, along with warmer temperatures, promote their growth so they proliferate into a bloom. Based on models of nutrient concentrations, most rivers and lakes with catchments in the urban, pastoral, and exotic forest land-cover classes have a higher risk of algal blooms.
Algal blooms degrade the recreational and cultural uses of waterways. They reduce the water quality for swimming and other activities, the number of fish (including trout and salmon), and opportunities for mahinga kai (food gathering) (see Poor water quality reduces cultural use, beliefs, and practices). Some cyanobacteria produce toxins that can be harmful to ecosystems and contaminate water for drinking and swimming. Dogs are particularly susceptible because they are attracted to the odour of some cyanobacteria. More than 70 dog deaths have been reported since 2006 across New Zealand as a result of consuming cyanobacteria from rivers (Our fresh water 2017).
A number of pollutants have human health risks when consumed in drinking water or food from polluted water, or from exposure while swimming.
Seven main waterborne illnesses are notifiable in New Zealand: campylobacteriosis, salmonellosis, shigellosis, yersiniosis, E. coli infection, giardiasis, and cryptosporidiosis (Ball, 2007; Ministry of Health, 2020). In 2017, there were 427 notifiable illness cases of campylobacteriosis, 250 of giardiasis, 219 of cryptosporidiosis, 135 of salmonellosis, and 88 of E.coli infection for cases where people reported contact with recreational water (river, lake, or sea). About 100 cases of two other notifiable waterborne diseases were also reported (ESR, 2019).
The presence of E. coli above a certain limit is used to indicate the health risk from the pathogen Campylobacter in rivers and lakes. Computer models estimate the average Campylobacter infection risk from swimming in any New Zealand river (Whitehead, 2018). For 2013–17, 94 percent of the river length in catchments in the urban land-cover class, 76 percent of the river length in catchments in the pastoral land-cover class, and 27 percent of the river length in catchments in the exotic forest land-cover class was not suitable for activities such as swimming. (This estimation is based on a predicted average Campylobacter infection risk of greater than 3 percent, National Objectives Framework bands D and E respectively – the two highest risk categories). Only 5 percent of the river length in catchments in the native land-cover class exceeded the same threshold.
Heavy metals and other pollutants in the freshwater environment (including pesticides) can accumulate in food sources like fish and shellfish, and making them unsafe to eat. Data from monitored sites indicates that this is a low risk for most New Zealanders. However, some Māori communities may be exposed to a higher risk than average because more eels and other wild-caught freshwater species are included in their diets. A 2011 risk assessment showed that contaminants in eels, trout, and flounder may lead to a higher risk of cancer and other chronic health issues for members of Arowhenua in South Canterbury (Stewart et al, 2011).
If freshwater pollution is high enough to risk contaminating wild-caught species, the local council will caution people to limit or stop eating certain species for health reasons. For Māori communities, these limits can restrict mahinga kai.
Most of New Zealand’s drinking water comes from rivers and underground aquifers, and is tested and treated by local authorities (district or city councils) to ensure it is safe. Many households and communities source their own drinking water from nearby rivers, lakes, and aquifers (via wells), and are responsible for its safety. If these sources are contaminated and the water is not properly treated, it can make people ill.
Many aquifers across New Zealand are periodically tested for water quality, using groundwater wells. Information is not available about which groundwater wells are used for drinking water and whether treatment is in place to remove pathogens and nitrate-nitrogen from well water.
Monitoring untreated water in aquifers for 2014–18 found that 68 percent of 364 sites failed to meet the drinking water standard for E. coli on at least one occasion. This indicates a potential risk of illness if untreated water is consumed. The drinking water standard of 11.3 grams per cubic metre of nitrate-nitrogen was also exceeded on at least one occasion at 19 percent of 433 sites tested. At these concentrations, nitrate-nitrogen has a potential risk of causing methaemoglobinaemia (blue baby syndrome) in bottle-fed infants.
The concentrations of pesticides in lakes and rivers are not measured routinely. Groundwater monitoring shows that the concentrations of pesticides in monitored aquifers currently pose a low health risk (Close & Humphries, 2019).
Many emerging contaminants that can be found in freshwater are suspected or known to present risks to human health, but are not commonly monitored in New Zealand. One example is PFAS – the extent of contamination and safe concentrations have not been fully established (see ‘Managing the risks of PFAS contamination’ box).
In 2018, several environmental investigations were undertaken at airfields and fire training sites where firefighting foams (used on high temperature fuel fires) have been sprayed onto the ground during incidents and exercises for decades. Many of these foams used to contain per- and poly-fluoroalkyl substances (PFAS). PFAS was identified as an emerging contaminant in the early 2000s, and the import, manufacture, and use of PFAS was banned in 2011.
The investigations found low concentrations of PFAS in groundwater, streams, and freshwater species near some sites (Walker & Callander, 2018; Shaw & King-Hudson, 2019). Because safe concentrations of PFAS in drinking water and food had not been confirmed at the time of the investigations, local councils took a precautionary approach to protect people in the affected areas.
Several town-supply and private water bores in Marlborough tested above the interim health guidelines for PFAS in drinking water that were recommended at the time of the investigation. The use of these bores was discontinued and water from other sources was used.
PFAS were detected in eels in the Oaonui Stream in Taranaki, which raised concerns that the eels were not safe to eat. Based on the best available advice, South Taranaki District Council erected warning signs at the stream mouth advising people not to eat fish or eels from the stream until the human health risks could be fully investigated.
Changes in water quality can significantly affect the mauri (life force), mana, and wairua (spirituality) of waterways (Morgan, 2006). The health and capacity of our waterways to provide, is a significant part of expressing ahikāroa (connection with place) and kaitiakitanga (guardianship).
Customary practices associated with mahinga kai contribute significantly to manaakitanga (acts of giving and caring for), whanaungatanga (community relationships and networks), te ahurea o te reo (growth and evolution of language), and whakaheke kōrero (opportunities for intergenerational knowledge transfer) (Harmsworth & Awatere, 2013; Lyver et al, 2017a; Timoti et al, 2017).
Some iwi and hapū monitor freshwater using cultural indicators to record changes. Although healthy rivers have natural growth (periphyton) on the rocks of a riverbed, too much can reduce the diversity and number of invertebrates and fish, and make swimming and fishing unpleasant (Biggs & Kilroy, 2000). How the bottom of a swimming hole feels on your feet is an indicator based on waipara (the sediment and periphyton in a waterway) used by some whānau to test swimmability (Coffin, 2018; Tipa & Teirney, 2006). Other characteristics of a place like the sound, smell, and clarity of water are also used as indicators of cultural health.
Our fresh water 2017 used a cultural health index (CHI) to assess water quality for sites at 25 rivers and five lakes in New Zealand. (See indicator: Cultural health index for freshwater bodies.) It was made up of three elements:
For the 41 sites where a CHI was assessed between 2005 and 2016, 11 sites had very good or good scores, 21 sites had moderate scores, and 9 sites had poor or very poor scores. (This indicator has not been updated for this report.)
The quality of water around our coasts is directly affected by the polluting nutrients, pathogens, and sediment that rivers carry downstream (Dudley et al, 2017). Monitoring data for 2013–17 showed that high nitrogen concentrations and high levels of faecal bacteria were present at coastal monitoring sites that received large amounts of water from rivers, particularly shallow estuaries. Deep estuaries have the best water quality because seawater moves freely in and out, so freshwater that enters them is well diluted by seawater. Coastal areas near many of our biggest rivers are not monitored so the scale of effects on coastal waters is not known. (See indicator: Coastal and estuarine water quality.)
Heavy metals primarily reach estuaries via urban streams, apart from the exception of cadmium, which can also come from farming areas. Data at most monitoring sites in 13 regions for 2015–18 showed the concentration of heavy metals in estuarine and coastal sediment was below the levels expected to affect bottom-dwelling species. The proportion of nutrients, pathogens, and sediment delivered from urban areas (as opposed to pastoral, exotic forest, or native areas) to estuaries and the coast is not known. (See indicator: Heavy metal load in coastal and estuarine sediment.)
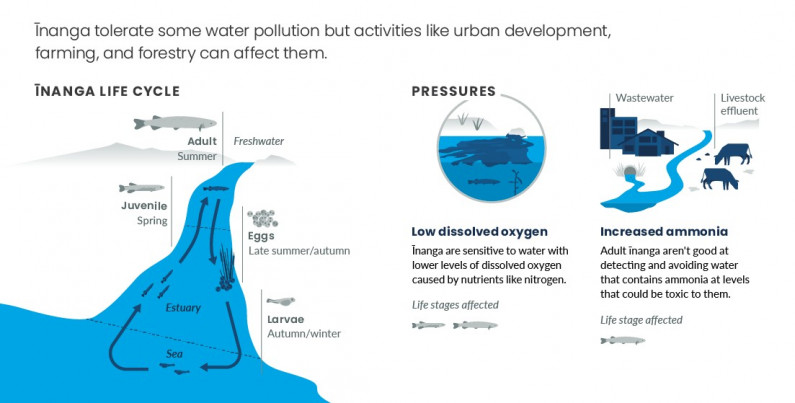
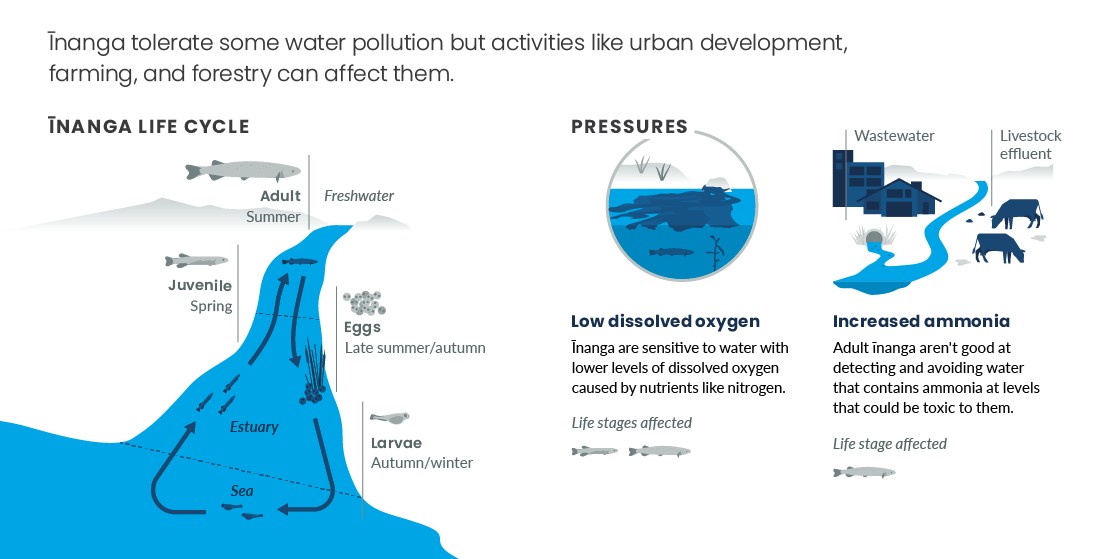
Read the long description for How our activities on land affect īnanga
Īnanga tolerate some water pollution but activities like urban development, farming, and forestry can affect them.
Low dissolved oxygen – īnanga are sensitive to water with lower levels of dissolved oxygen caused by nutrients like nitrogen. This affects the juvenile and adult stages of the īnanga life cycle.
Increased ammonia – adult īnanga aren’t good at detecting and avoiding water that contains ammonia at levels that could be toxic to them.
The behaviour and toxicity of a range of chemicals, industrial pollutants, and by-products from our activities are not fully understood. Time-series data that is long enough and high enough resolution to help build this knowledge is rarely available for emerging contaminants and microplastics.
New research programmes are beginning to collect data for emerging contaminants in our waterways, but their extent and potential effect on ecosystems are generally not known (Close & Humphries, 2019; Bernot et al, 2019; Stewart et al, 2016). The risk these contaminants pose to human health cannot be fully assessed without knowing if (or at what concentrations) they are present in drinking water or wild food.
Catchments can contain a mix of land-cover types and land uses. Each land use can generate pollution that can affect water quality in different ways. Pollution can come from one place and a single activity, like a pipe, drain, or culvert. It can also originate from a range of activities across a wide area, and therefore be harder to trace to a particular source.
Our overall understanding of the causes, effects, and cumulative impacts of pollution is improving but is still limited. Particularly in urban catchments, the complexity of human activities and potential sources, including emerging contaminants, are barriers to better understanding.
Water quality trends are also poorly understood. Some trends may be caused by variations in climate or other natural processes that are currently not accounted for, so the contribution of human activities is difficult to determine. At some locations, it may be challenging to isolate the input of nutrients from their source, for example, from farming or treated wastewater.
In the urban environment, wastewater and stormwater networks are complex, and parts can fail for a variety of reasons. We know such failures can contribute to poor water quality, but the scale of these contributions is not known as no comprehensive investigations of the effects of these failures on the environment have been undertaken.
In the rural environment, data clearly shows that water quality in pastoral farming areas is degraded across New Zealand. At a local scale, we lack sufficient information about exactly where, when, and what activities and management practices (like tilling soil, stock density, fertiliser use, and managing stock effluent and access to waterways) have contributed to or reduced water pollution in farming areas (McDowell et al, 2019). Having no national-scale database or map of farm management practices is one cause of the information gap.
In places with long lag times, today’s water quality may be the result of past management practices rather than what we are doing now. More information is also needed about the flow and natural absorption of pollutants as they move through catchments. This includes variations between catchments, including their geology and soils, climate, and ecosystems, as well as where and how groundwater and surface waters (lakes and waterways) interact.
Because of these large knowledge gaps, it is difficult to assess the full impacts of land management practices on water quality, or measure improvements in water quality from actions like planting beside waterways.
We don’t yet know how changes in water quality affect the overall health of ecosystems. A framework to describe ecosystem health more holistically has been developed (Clapcott et al, 2018) but choosing the parameters to evaluate it is still underway (see Towards a better understanding of our environment).
National datasets are lacking for some of the variables relevant to ecosystem health (like deposited sediment, physical habitat, continuous dissolved oxygen, and algal biomass). Biodiversity and native fish populations, including taonga species, also have insufficient information (Our fresh water 2017). Very little is known about the freshwater ecosystems that require a connection to groundwater to function. Also, the interacting and cumulative effects of water pollution and other pressures on ecosystem health are not well understood (Larned et al, 2018).
Our knowledge contains critical gaps about the impacts of water pollution on te ao Māori, including how mātauranga Māori, tikanga Māori, kaitiakitanga, customary use, and mahinga kai are affected. Although some relevant data is available (see Kusabs et al, 2015), we lack information about how changes in land use affects Māori freshwaterdependent values (Larned et al, 2018).
Information about the impacts of water pollution on human health is also poor. Regional councils monitor water quality at approximately 150 of New Zealand’s lakes, but E. coli is monitored at very few of these (Larned et al, 2018).
New research programmes are beginning to collect data on emerging contaminants in our waterways. These include pesticides, pharmaceuticals, nanoparticles, and other chemicals that are now often found in waterways overseas (Petrie et al, 2015). The negative effects of emerging contaminants on freshwater ecosystems are not well understood, and very few studies have assessed their impacts on New Zealand’s native species (Stewart et al, 2016). Data to assess the risk to human health from most emerging contaminants in fish or shellfish is also not available.

Issue 2: Water is polluted in urban, farming, and forestry areas
April 2020
© Ministry for the Environment