Ngā tukunga rāngai para Waste sector emissions 

This page provides historical trends of greenhouse gas emissions from the waste sector. It features an interactive dashboard displaying the data, outlines the policies targeted at reducing emissions of these gases, and examines the projected impact of these policies on methane emissions.

About waste emissions data

Waste sector emissions data is sourced from the dedicated waste chapter (chapter 7) of Te Rārangi Haurehu Kati Mahana a Aotearoa, New Zealand Greenhouse Gas Inventory, 1990-2022 (the inventory). The inventory is the official annual estimate of all human-induced emissions and removals of greenhouse gases (GHGs) in New Zealand. The inventory provides the official basis for measuring New Zealand’s progress under the United Nations Framework Convention on Climate Change and for tracking its performance in achieving emissions reduction targets.
  
Visit the greenhouse gas emissions targets and reporting page for more information.

Waste sector emissions dashboard 

The waste sector emissions dashboard presents data from chapter 7 of the inventory covering the period from 1990-2022. The inventory is updated annually and reports data with a two-year lag. See chapter 7 of Te Rārangi Haurehu Kati Mahana a Aotearoa, New Zealand Greenhouse Gas Inventory, 1990-2022.  

To expand the dashboard, click the arrow icon at the bottom right of the window.  

Where our waste sector emissions come from

In 2022, emissions from managed fills, unmanaged fills and farm fills contributed about three quarters of total waste sector emissions. With a range of other sources including composting, open burning and incineration making smaller methane contributions.

The rise and fall in historical ‘managed landfill’ emissions was largely driven by the growing tonnages of organic waste being disposed at municipal landfills. This was followed by the implementation of gas capture requirements for larger municipal landfills in 2004.

What we have done to reduce waste emissions

Since 2004, improvements in waste management and landfill gas capture at municipal landfills have resulted in a significant reduction of waste sector emissions.

In 2022, waste sector emissions were 19.8 per cent below 1990 levels. This highlights the positive impact of regulation of a significant proportion of municipal landfills in New Zealand.

The reduction of emissions from the waste sector is attributed to a number of initiatives implemented to improve solid waste management practices in New Zealand. 

These initiatives include:

  • requiring municipal landfills to meet resource consent conditions under the Resource Management Act 1991
  • requiring large municipal landfills to operate landfill gas capture systems (LFG) according to the National Environmental Standards for Air Quality (2004) under the Resource Management Act 1991
  • providing direction and guidance to local governments and the waste sector through the New Zealand Waste Strategy and its revision in 2010
  • developing the Solid Waste Analysis Protocol to set up a consistent waste classification system, sampling regimes and survey procedures for the estimation of solid waste composition
  • implementing a waste disposal levy for waste sent to class 1-4 landfills and enabling regulations to establish product stewardship requirements under the Waste Minimisation Act 2008.

In 2022, 93.3 per cent of waste emissions were biogenic methane – largely generated by the decomposition of organic waste (such as food, garden, wood and paper waste). While waste contributes a small percentage of our total emissions, biogenic methane has a warming effect 28 times greater than carbon dioxide. 
Looking forward

Current measures will not be enough to meet the ambitious target recommended by the Climate Change Commission of a 40 per cent reduction in waste biogenic methane emissions by 2035. However, the New Zealand waste management sector is well placed to transition to a low emissions economy over the next decades.

Significant reductions in biogenic methane emissions generated from organic waste are feasible with solutions that are well proven. For example, New Zealand is one of many countries that have established, or are in the process of adopting, processing technologies for food waste.

See Improving household recycling and food scrap collections for more information.  

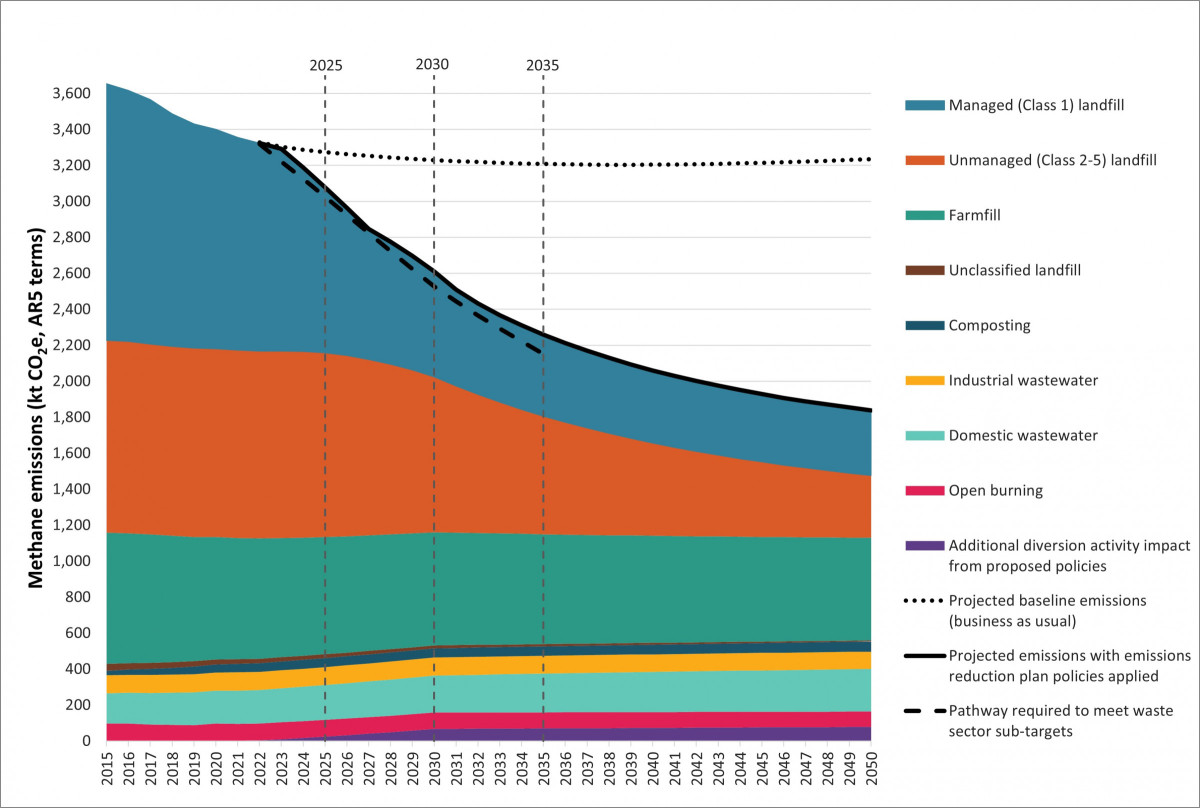
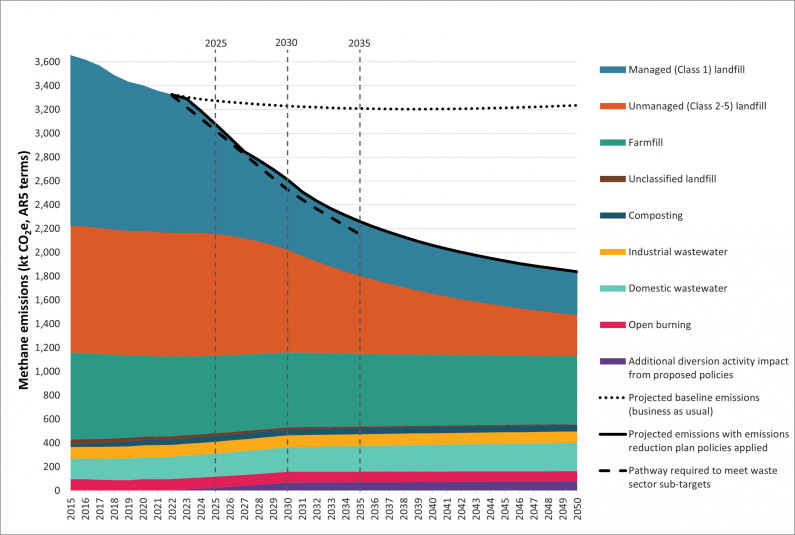
The following graph shows that the cumulative impact of waste policies from the emissions reduction plan come close to meeting the first waste sector sub-target (2022–2025). This scenario also indicates that greater emissions reductions will be required from 2026–2035 to meet subsequent emissions budgets.  

While this ambitious target is technically feasible, we must act quickly to meet emissions budgets set by the Government for 2022-2025.

See the waste chapter of the emissions reduction plan for more information.  

Total projected methane emissions from waste — showing the impact of combined waste policies and measures 

projected emissions from waste graph v2
High and low impact scenarios were modelled. This graph shows the central impact scenario only.
projected emissions from waste graph v2
High and low impact scenarios were modelled. This graph shows the central impact scenario only.

Provide feedback

To give us feedback on this content, please complete this brief survey.

Contact us

If you have any questions, please email the National Waste Data Reporting team at nwdrp@mfe.govt.nz.