Latest update on New Zealand's 2020 net position

The latest update on New Zealand’s 2020 target and how it is calculated. We used the net position to track progress towards our international emissions reduction target for the period 2013–2020 (our 2020 target).

About the target

New Zealand has an international target to reduce our greenhouse gas emissions to 5 per cent below 1990 levels for the period 1 January 2013 to 31 December 2020. This is represented as the carbon budget for the period.

New Zealand has met its 2020 target

  • New Zealand has met its 2020 emissions reduction target by applying the Kyoto Protocol accounting framework.
  • The target has been met through contributions from forestry activities and international units.

The latest net position update is based on New Zealand’s Greenhouse Gas Inventory (1990-2020), which covers the period from 1990 to 2020. 

Based on the 2022 submission of New Zealand’s Greenhouse Gas Inventory:

  • New Zealand’s gross emissions for the 2013–20 period were 639.6 million tonnes carbon dioxide equivalent (Mt CO2-e).
  • Forestry activities removed 123.3 Mt CO2-e from the atmosphere over the 2013–20 period.
  • New Zealand’s net emissions were 1.03 per cent higher than the carbon budget available after accounting for forestry activities.
  • The difference required to meet the 2020 target was met with 6.5 million international units retained from the first commitment period of the Kyoto Protocol (CP1).
  • This left a surplus of 21.5 million CP1 units.

The 2020 target was formally finalised in September 2023 with the submission of the True-up Report to the United Nations Framework Convention for Climate Change (UNFCCC). The Government also cancelled the remaining surplus Kyoto-era units.

New Zealand’s net position for the 2013 to 2020 period

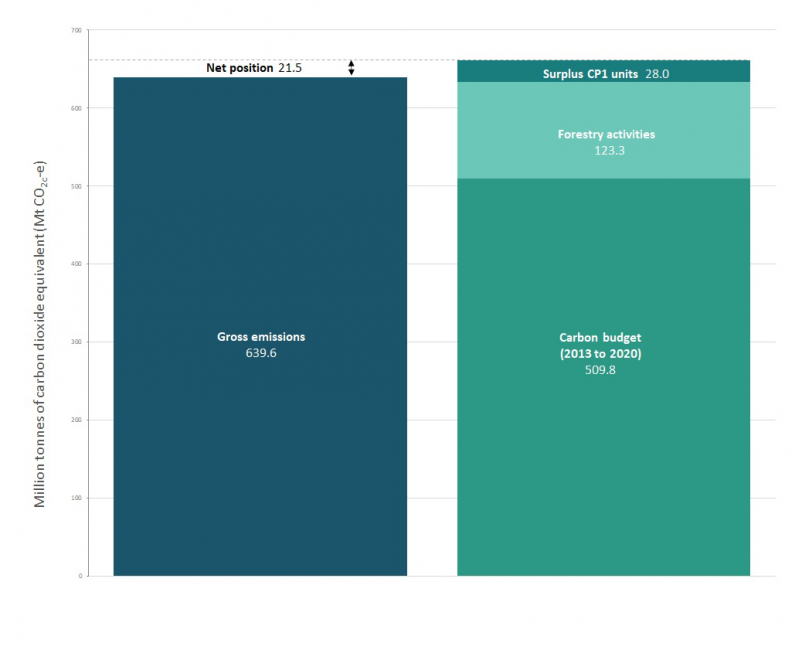
net position graph
Note: Numbers may not add to totals due to rounding to one decimal place.

This is a two column bar chart.

Column one shows New Zealand’s gross emissions for the period 2013-2020 are 639.6 million tonnes of carbon dioxide equivalent.

Column two is stacked, showing the carbon budget for 2013-2020, forestry activities, and surplus commitment period one units, totalling 661.0 million tonnes of carbon dioxide equivalent.

  • The carbon budget allows 509.8 million tonnes of carbon dioxide equivalent to be emitted. This is equal to a 5% reduction in gross emissions below 1990 levels on average across the 2013-2020 period. This is our 2013-2020 target
  • Forestry activities that are able to be counted towards meeting our target removed 123.3 million tonnes of carbon dioxide equivalent over the 2013-2020 period
  • We hold a surplus of commitment period one units representing the removal of 28.0 million tonnes of carbon dioxide equivalent that are also able to be counted towards meeting our 2013-2020 target.

There is a double pointed arrow above the first column showing the difference between the two columns. This is the net position. The net position for the 2013-2020 target is currently a surplus of 21.5 million tonnes of carbon dioxide equivalent.

For information on how New Zealand’s 2020 net position was calculated, the accounting framework and the carbon budget (also referred to as the emissions budget) see New Zealand’s initial report.

Target accounting for 2013 to 2020 – the detail

The table below sets out the contributions to the target and how it was calculated.


Emissions estimate

 Contribution

2013

2013

2015

2016

2017

2018

2019

2020

TOTAL

2013 to 2020 carbon budget


509.8

Forestry activities: Afforestation and reforestation, and deforestation

8.6

11.3

13.1

13.6

15.6

15.4

13.6

13.4

104.6

Forestry activities: Forest management


18.7

18.7

Surplus CP1 units


28.0

Total


661.1

Emissions


Energy

32.1

32.2

32.4

31.0

32.5

32.5

33.9

31.5

258.0

Industrial processes and product use

4.8

5.0

5.1

4.9

4.9

4.8

4.9

4.6

39.1

Agriculture

39.3

39.9

39.4

39.0

39.1

39.4

39.5

39.4

315.1

Waste

3.6

3.5

3.5

3.5

3.4

3.4

3.3

3.3

27.4

Gross emissions

79.8

80.6

80.4

78.4

79.9

80.1

81.6

78.8

639.6

Net position


21.5

Note: All emissions are in Mt CO2-e. Units represent one tonne of greenhouse gas emissions as carbon dioxide equivalent (CO2-e) removed from the atmosphere. Numbers may not add to totals due to rounding to one decimal place.

Carbon budget for 2013 to 2020

For our 2020 target, New Zealand’s carbon budget for the period 2013 to 2020 was 509.8 Mt CO2-e.

This budget was based on 1990 gross emissions reported in New Zealand’s Greenhouse Gas Inventory 1990–2014 published in 2016 and calculated according to United Nations Framework Convention on Climate Change (UNFCCC) guidance (refer to New Zealand’s Initial Report for further information on the target, budget and accounting framework). 

Accounting for forestry activities

In line with the Kyoto Protocol framework of rules, mandatory forestry activities must be included in accounting for targets.

New Zealand’s forestry activities provided a net removal of 123.3 Mt CO2-e towards meeting our 2020 target.

The contribution from forest management activities was accounted for against a reference level, and up to a capped amount. This contributed a net removal of 18.7 Mt CO2-e towards the 2020 target.

For more information, refer to chapter 11 of the 2022 inventory submission.

Gross emissions

Gross emissions were sourced from the 2022 inventory submission. These estimates covered all sectors excluding Tokelau, as emissions from Tokelau were not included in New Zealand’s inventory when the target was taken and carbon budget was set.

These estimates are reported in the sector categories described below.

Sector category

Gross emissions

Energy

Energy emissions totalled 258.0 Mt CO2-e for the period 2013 – 2020.


Emissions for energy over 2013 to 2020 were fairly stable. This was due to decreases in stationary and fugitive energy emissions, alongside increases in transport emissions.


The increase in transport emissions was driven by population growth and demand for petrol and diesel for road transport.


Industrial processes and product use (IPPU)

IPPU emissions totalled 39.1 Mt CO2-e for the period 2013 – 2020.


Emissions form IPPU were fairly stable over the 2013 to 2020 period. The decline in emissions reported in 2020 was due to COVID-19 restrictions causing plant shutdowns and reduced production.


In October 2016, New Zealand adopted the Kigali Amendment to the Montreal Protocol to phase down hydrofluorocarbon consumption and production along with nearly 200 other parties worldwide. New Zealand ratified the amendment in October 2019 and it entered into force for New Zealand on 1 January 2020.

Agriculture

Agriculture emissions totalled 315.1 Mt CO2-e for the period 2013 – 2020.


Emissions from Agriculture were fairly stable over the 2013 to 2020 period.


This was largely due to decreases in the sheep population being offset by modest increases in cattle numbers. This has subsequently resulted in greater use of synthetic fertiliser.

Waste

Waste emissions totalled 27.4 Mt CO2-e for the period 2013 – 2020.


Waste emissions declined over the 2013 to 2020 period. This was mainly due to the changing composition of managed landfills, where a decreasing proportion of the waste disposed contains readily decomposable material. This more than makes up for the overall increase in the volume of waste disposed.

International units from the Kyoto Protocol First Commitment Period

The Crown held over 28 million surplus international units from the Kyoto Protocol’s first commitment period (surplus CP1 units) that the Government was confident had environmental integrity.

After cancelling 6.5 million of the units to meet the 2020 target in September 2023, the Government decided to also cancel all remaining 21.5 million units in the Crown Holding Account.

In mid-2020, the Government had cancelled 95.4 million units that were of low or questionable quality. Additionally, around 0.3 million units have been cancelled since 2016 through voluntary cancellations. The table below provides the detailed changes that have occurred since the CP1 target was met.

Units retained from CP1

123,749,012

Units cancelled by the Government in mid-2020

95,400,000

Units cancelled through voluntary cancellations (since 2016)

331,797

Units cancelled by the Government to meet the 2013-2020 target

6,544,586

Remaining surplus units cancelled

21,472,629

CP1 units (as at 26 September 2023)

0