Clause 3.13: Special provisions for attributes affected by nutrients

Nutrient outcomes needed to achieve target attribute states means the instream concentrations and exceedance criteria, or instream loads, for nitrogen and phosphorus, adopted under clause 3.13(4)
The intent of clause 3.13 is to manage nutrients as part of achieving the overall value of ‘ecosystem health’. The policy achieves this by directing councils to manage the amounts of nitrogen (N) and phosphorus (P) in water bodies. The policy recognises that monitoring and managing N and P provides for ecosystem-health outcomes for a range of nutrient-affected attributes, which may include attributes such as, periphyton, dissolved oxygen and macroinvertebrates.
The amount of nitrogen and phosphorus in water bodies must be set to achieve TASs for:
Clause 3.13 of the NPS-FM is part of the process for achieving TASs, environmental outcomes and long-term visions.
To provide for the compulsory value of ecosystem health, regional councils must:

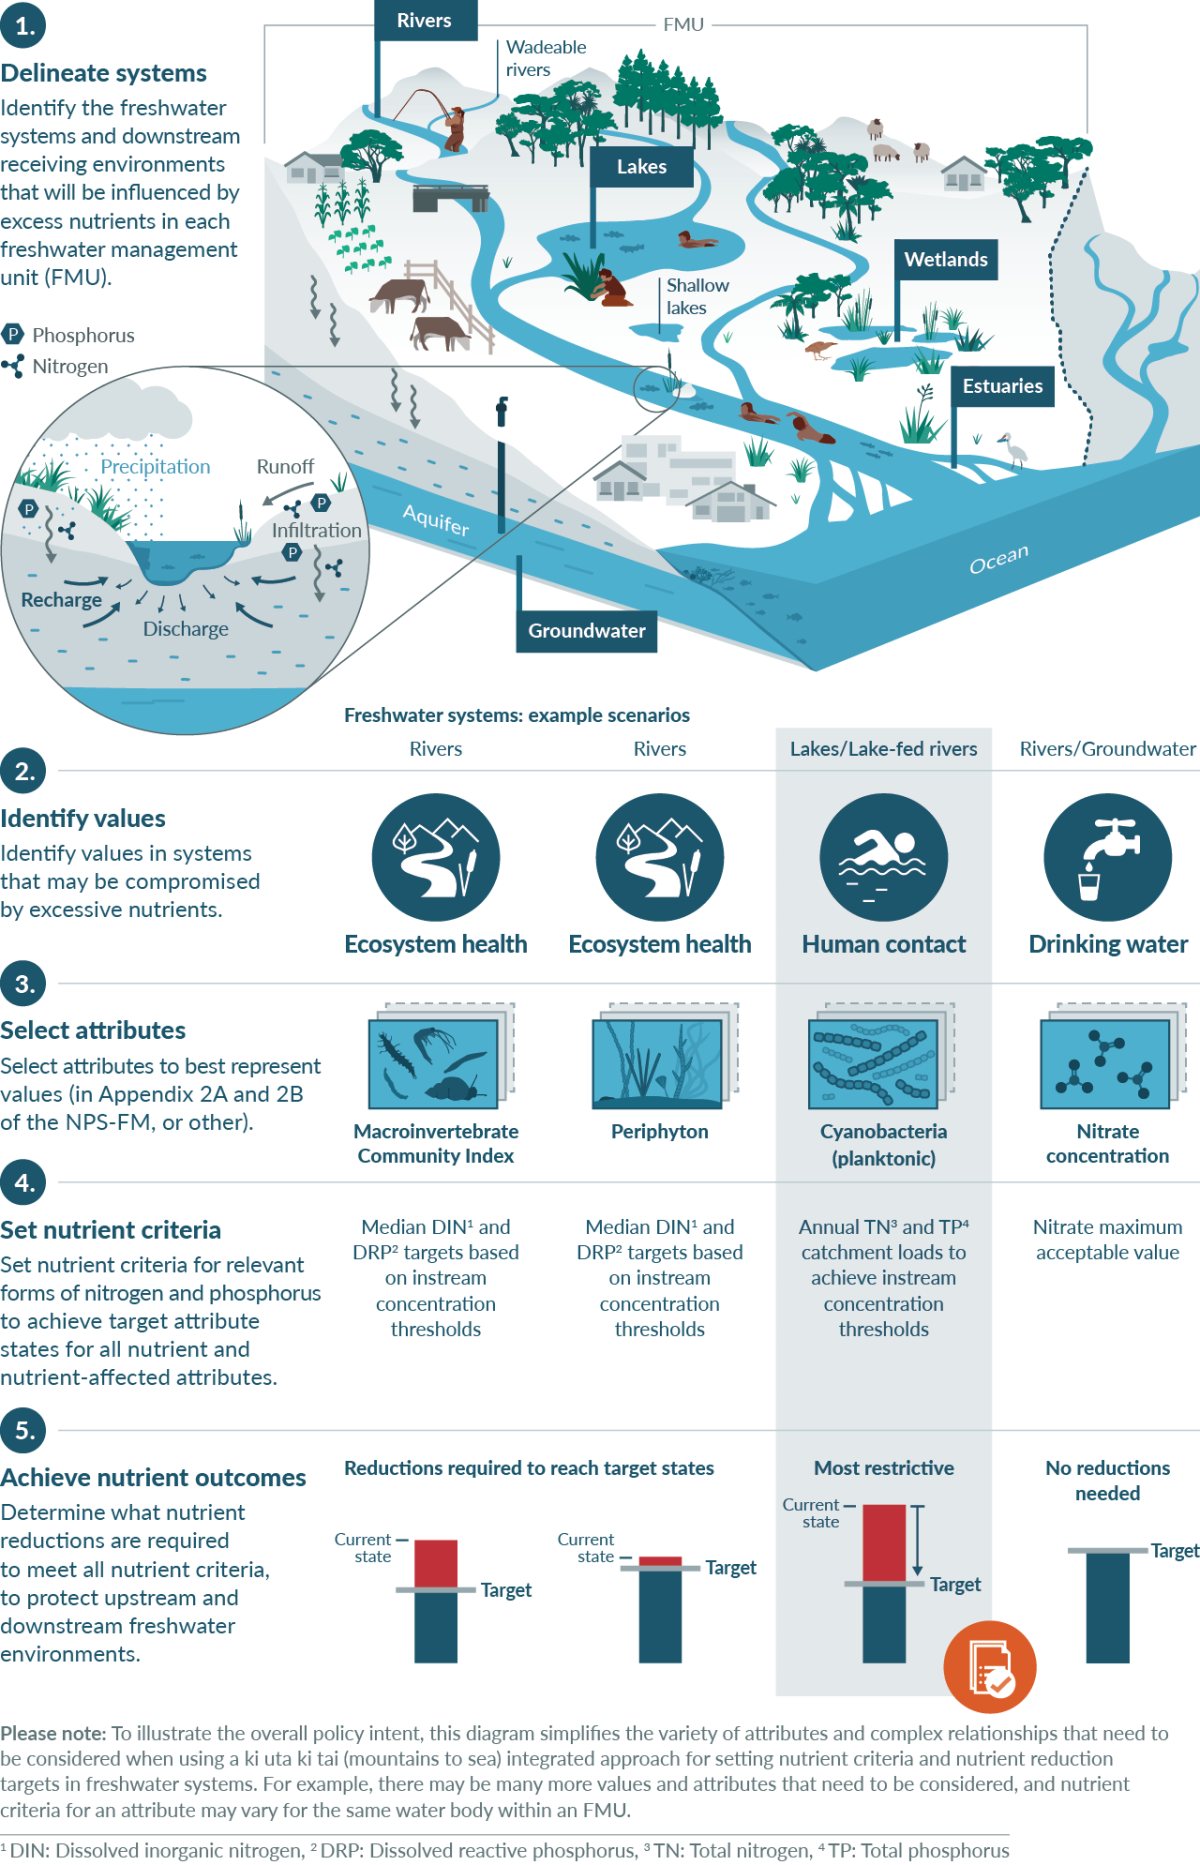
An infographic showing example scenarios of the process for setting nutrient criteria to achieve NPS-FM target attribute states for freshwater systems, broken down into 5 steps.
The steps are.
Step 1. Delineate systems.
Identify the freshwater systems and downstream receiving environments that will be influenced by excess nutrients in each freshwater management (FMU). An illustration next to step 1 shows the following freshwater systems: rivers, lakes, wetlands, groundwater and estuaries. Further details in the landscape are labelled. These are: wadeable rivers, shallow lakes, the ocean and an aquifer. A bubble shows more detail of a part of a river. The labels in the bubble are: precipitation, runoff, infiltration, discharge and recharge, and there are icons to indicate where phosphorous and nitrogen are present.
Step 2. Identify values.
Identify values in systems that may be compromised by excessive nutrients.
Step 3. Select attributes.
Select attributes to best represent values (in Appendix 2A and 2B of the NPS-FM, or other).
Step 4. Set nutrient criteria.
Set nutrient criteria for relevant forms of nitrogen and phosphorus to achieve target attribute states for all nutrient and nutrient-affected attributes.
Step 5. Achieve nutrient outcomes.
Determine what nutrient reductions are required to meet all
nutrient criteria, to protect upstream and downstream freshwater environments.
The infographic illustrates four example scenarios for different freshwater systems.
Example scenario 1.
Step 1: The freshwater system identified is a river.
Step 2: The value is ecosystem health.
Step 3: The attribute is the Macroinvertebrate Community Index.
Step 4. The nutrient criteria are median dissolved inorganic nitrogen and dissolved reactive phosphorus targets based on instream concentration thresholds.
Step 5: A small graph shows both the current state and target state, and reductions required to meet the target state.
Example scenario 2.
Step 1: The freshwater system identified is a river.
Step 2: The value is ecosystem health.
Step 3: The attribute is periphyton.
Step 4. The nutrient criteria are median dissolved inorganic nitrogen and dissolved reactive phosphorus targets based on instream concentration thresholds.
Step 5: A small graph shows both the current state and target state, and reductions required to meet the target state.
Example scenario 3.
Step 1: The freshwater system identified is lakes and lake/fed riveres.
Step 2: The value is human contact.
Step 3: The attribute is cyanobacteria (planktonic).
Step 4. The nutrient criteria are annual total nitrogen and total phosphorus catchment loads to achieve instream concentration thresholds.
Step 5: A small graph shows both the current state and target state, and reductions required to meet the target state. The graph shows a substantial reduction required and the graph is labelled ‘most restrictive’.
Example scenario 4.
Step 1: The freshwater system identified is a rivers/groundwater.
Step 2: The value is drinking water.
Step 3: The attribute is nitrate concentration.
Step 4. The nutrient criteria is nitrate maximum acceptable value.
Step 5: A small graph shows that the current state is the same as the target state. The graph is labelled ‘no reductions needed’.
A note beneath the infographic states.
Please note: To illustrate the overall policy intent, this diagram simplifies the variety of attributes and complex relationships that need to be considered when using a ki uta ki tai (mountains to sea) integrated approach for setting nutrient criteria and nutrient reduction targets in freshwater systems. For example, there may be many more values and attributes that need to be considered, and nutrient criteria for an attribute may vary for the same water body within an FMU.
In practice, managing nutrients in order to achieve all TASs in an FMU, or part of an FMU, means the most sensitive attribute (with the most stringent TAS) will determine the overall nutrient criteria. Attributes that are most sensitive to nutrients will likely show up in the most sensitive part of the freshwater system, such as in downstream receiving environments. For example, it might be that the TAS for MCI in a downstream river determine the nutrient concentrations (N and P) you need to set and adopt as nutrient outcomes to achieve all other TASs.
The choice of nutrient criteria is important when determining how to regulate and cap contaminant loads. This is because different attributes respond to nutrients in different ways, and nutrients will behave differently in different parts of the freshwater system. See figure 6 for how to determine nutrient criteria for the most sensitive TASs.
Clause 3.13 applies to all nutrient-affected attributes across all freshwater ecosystems and freshwater bodies.
The attributes that councils and communities choose to measure and monitor will depend on factors like the part/type of water body and the water body substrate. Within a given FMU (or sub-FMU), whether the river is soft-bottomed (silty and muddy) or hard-bottomed (stony and gravelly) will help to determine the attributes chosen, as different stream types support some attributes and not others.
For example, a council choosing nutrient criteria for a representative soft-bottomed stream needs to take into account that this stream type does not commonly support periphyton growth. In this situation, it will be likely that there are other attributes that are more limiting than periphyton, and it is advised that the council should focus on other nutrient attributes and/or nutrient-affected attributes when setting nutrient criteria.
There is no set timeframe for achieving TASs under clause 3.13. Councils need to set nutrient outcomes needed to achieve TASs for both upstream contributing water bodies and nutrient-sensitive downstream receiving environments, and work towards these over time (with interim states set for no longer than 10 years).
The timeframes will vary between regions and FMUs (or sub-FMUs), depending on the region’s existing land use, as well as other factors. Refer to clause 3.11 when identifying sites and applying a specific timeframe for achieving TASs (see Clause 3.11: Setting target attribute states).
Where an FMU contains nutrient-sensitive downstream receiving environments, such as lakes and estuaries, councils must set targets for N and P to provide for these ecosystems. A compulsory attribute is already in place for total N and total P in lakes, however, estuaries and groundwater do not have pre-defined N attributes.
Nutrient outcomes for upstream contributing water bodies must consider the environmental outcomes for nutrient-sensitive downstream receiving environments, including the coastal environment. Councils must set concentrations that protect a specific attribute state (eg, MCI) and ensure that nutrient concentrations set are stringent enough to achieve the objectives for downstream receiving environments.
In addition to lakes, other receiving environments that should be considered include:
As best practice, councils should holistically consider all the nutrient-affected attributes, the environmental outcomes for downstream receiving environments and upstream contributing water bodies (clause 3.13(4)), and take into account the interactions of the various attributes.
N and P should not be managed in isolation. When implementing clause 3.13 and the NPS-FM, the focus should be on achieving all TASs (eg, for periphyton, MCI, all other attributes affected by nutrients) and providing for ecosystem health more broadly. This is why councils need to determine nutrient criteria in the context of all TASs and efforts to achieve ecosystem health.
While nutrient attributes reflect/describe the ecosystem-health measures of the nutrient within the water body, there are many complex and interacting factors that influence ecosystem health in freshwater systems. For example, flows, temperature and dissolved oxygen will affect periphyton growth and therefore affect ecosystem health; these attributes will also need to be managed to achieve TASs and provide for ecosystem health.
Clause 3.13(5) gives examples of other attributes affected by nutrients, for instance, macroinvertebrate measures and Fish IBI. These are the water quality measures that have direct links to impact on aquatic ecosystems.
This is not a closed list; there will be other parts of ecosystems that may be affected by nutrients, which councils may choose to determine criteria for and protect. And, although the measures for TASs in clause 3.13 must be achieved, there may be other metrics (such as species populations) for measuring and accounting for the effects of nutrients on ecosystems.
Clause 3.13 does not prohibit using attribute measures for managing instream nutrient concentrations. Councils can determine whether ecosystem health has been achieved by assessing whether TASs/interim TASs have been met for attributes in appendix 2A and 2B of the NPS-FM, as well as any other attributes identified by councils and communities as part of their NOF processes.
Periphyton is one of many attributes for managing nutrients (see clause 3.13(5) for further examples).
Where periphyton is present, setting outcomes to manage periphyton alone will not necessarily lead to improvements in the overall health of freshwater and freshwater ecosystems.
In setting the nutrient criteria for a water body, councils should identify the attribute that is most sensitive to the effects of eutrophication. In rocky bottom streams, councils can measure periphyton, but must also measure other attributes; this is because periphyton may not be the most restrictive or sensitive of the attributes, and therefore managing periphyton may not achieve the TAS for other attributes.
The attributes that councils and tangata whenua identify for the compulsory value of mahinga kai are likely to include attributes affected by nutrients. Interactions within an ecosystem are complex and, although there is not always data and science to support this, the assumption can be made that nutrient concentrations are likely to affect aspects of mahinga kai, such as relative abundance of fish, biodiversity, and the ability to carry out customary practices.

Clause 3.13: Special provisions for attributes affected by nutrients
July 2022
© Ministry for the Environment