Two people stand by a wind turbine on a hill.

Tracking progress Carbon Neutral Government Programme

In December 2023, 84 CNGP participants from Tranches 1, 2, and 3 reported their emissions, reduction targets, and plans to achieve them.

This is the first year that participants from all tranches have reported, providing the most comprehensive understanding to date of the New Zealand government’s emissions profile.

2023 reporting

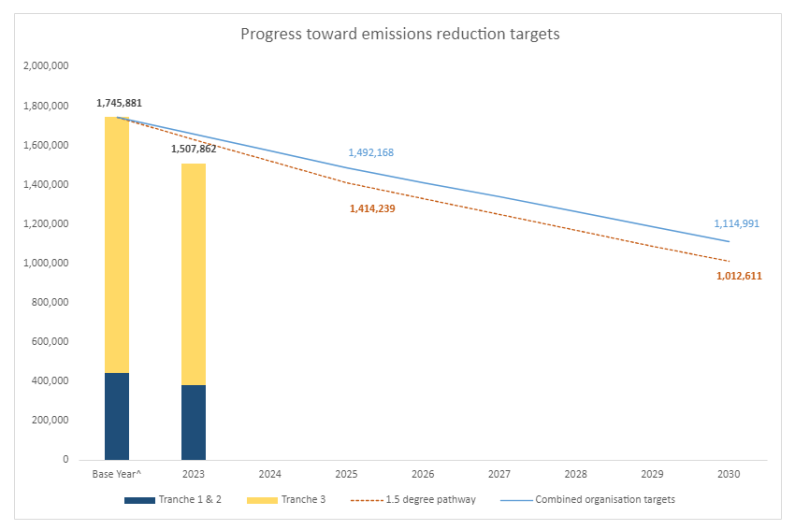
Overall, CNGP emissions reported for 2023 were 1,507,862 tCO2-e. For most participants, this is from financial year 2022/23, and for some it is from calendar year 2022. This is a 14% (238,019 tCO2-e) reduction from base year and on track to achieve 2025 targets.

Progress toward targets

progress toward targets
Progress toward emissions reduction targets 

2023 reporting shows programme emissions tracking below the target lines.

Organisations’ combined 2030 target adds up to 1,114,991 tCO2-e; less ambitious than the recommended 1.5 aligned target of 1,012,611 tCO2-e.

Tranche 3 is a large proportion (86%) of total Programme emissions in 2023 reporting, and have made the largest reductions.

Tranches 1 and 2

Sixty-six public sector organisations were directed to participate in the CNGP in 2023. This number includes 39 Tranche 1 organisations (Public Service Departments, Departmental Agencies and the Executive Branch) reporting to the CNGP for the second time, and 27 Tranche 2 organisations (Crown Agents and schools) reporting for the first time.

Top emission sources for Tranche 1 and 2 organisations

Tranche 1 and 2 organisations
Top emission sources for Tranche 1 and 2 organisations


Base year Current year % change from base year % of total (current year)
Air travel (all classes)

120579

91439

 -24%

 24%

Transport fuels- vehicle fleet

75197

62176

 -17%

 16%

Transport fuels – aviation

43230

37512

 -13%

 10%

Electricity (including T&D losses)

46958

37439

 -20%

 10%

Stationary combustion- Nat gas & LPG (including T&D losses

29602

26133

 -12%

 7%

Transport fuels- maritime

 26871

20621

 -23%

 5%

Freight – rail, road, coastal shipping, couriers

 7871

 18225

 132%

 5%

Agriculture

 16776

 15475

 -8%

 4%

Waste (to landfill)

 14628

 10831

 -26%

 3%

Non-air transport (e.g. taxi)

 5326

 7733

 45%

2%

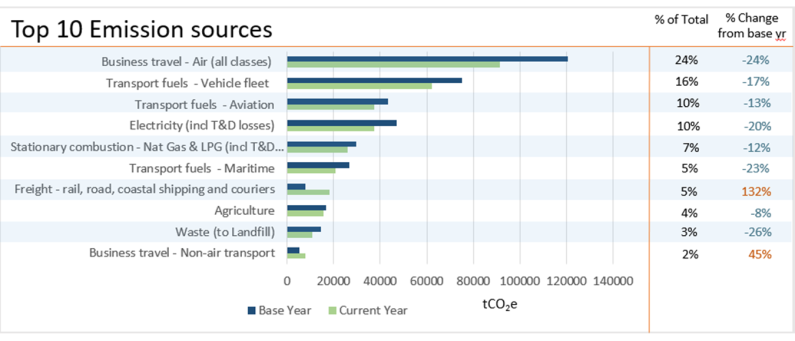
Total emissions from Tranches 1 and 2 were 383,505 tCO2-e, a 13% reduction from base year. Forty-four of these organisations reported reductions of 20% or more, and 70% reported they are confident or likely to achieve their 2025 reduction target.

Further emissions data from Tranches 1 & 2 is available here.

Tranche 3

Twenty-eight organisations, including state-owned enterprises and tertiary institutions, were encouraged to join the programme from 2023. Of these, 18 organisations submitted reports to the CNGP in 2023, with more indicating they will join the programme in 2024.

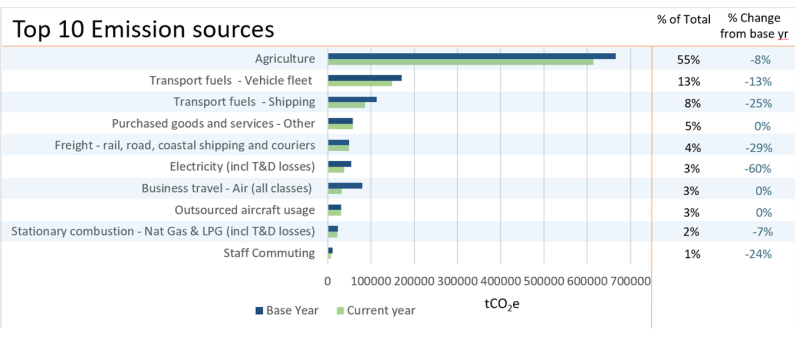
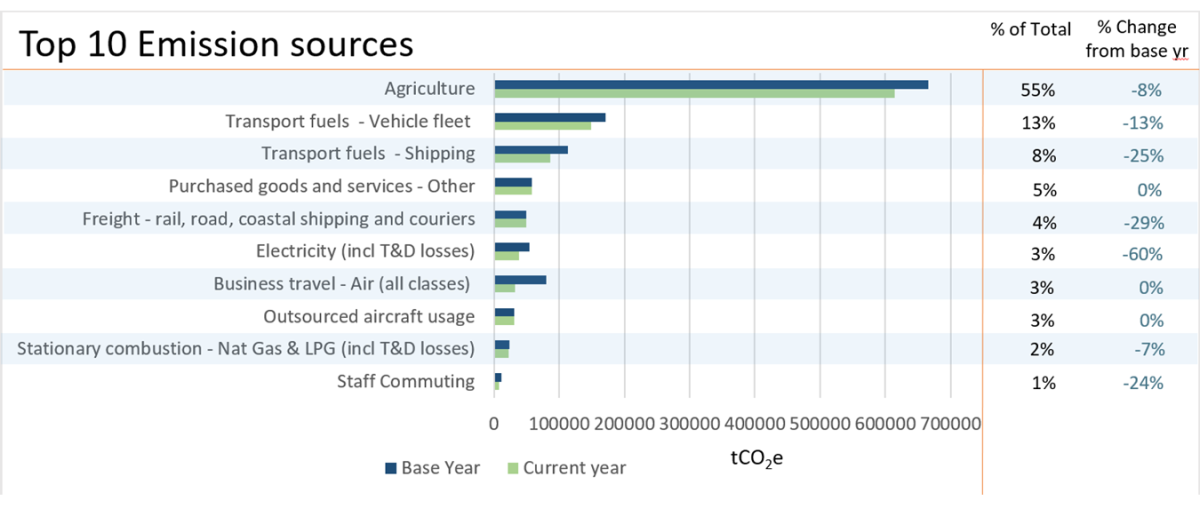
Top emission sources for Tranche 3 organisations

Tranche 3 organisations
Top emission sources for Tranche 3 organisations


Base year Current year % change from base year % of total (current year)
Agriculture

666032

613808

 -8%

 55%

Transport fuels - Vehicle flee

170919

148879

 -13%

 13%

Transport fuels - Maritime

113723

85742

 -25%

 8%

Purchased goods and services - Other

57633

57820

0.3%

 5%

Freight - rail, road, coastal shipping and couriers

48876

48978

 0.2%

 4%

Electricity (incl T&D losses)

 54458

38640

-29%

 3%

Air travel (all classes)

 79864

 32267

 -60%

 3%

Outsourced aircraft usage

 31349

 31349

 0%

 3%

Stationary combustion - Nat Gas & LPG (incl T&D losses)

 24244

 22606

 -7%

 2%

Staff Commuting

 10827

 8198

 -24%

1%

Total emissions from Tranche 3 were 1,124,357 tCO2-e. This is a 14% reduction from base year.

Further emissions data from Tranche 3 is available here.

Key emission sources in the CNGP

Air travel

Air travel accounted for 8% of 2023 reported emissions across all tranches. This includes any travel on a commercial plane such as for overseas diplomacy, site visits, and community engagement and consultation (organisation-controlled aircraft, such as NZDF planes, are counted separately).

Across the programme, air travel emissions reduced 38% since base year. Air travel is still one of the highest emission sources for a majority of CNGP participants, and many organisations are looking at further opportunities for reductions.                            

To date, 29 organisations have implemented policy changes toward minimising air travel. A further 14 organisations reported they plan to implement travel policy changes in 2024.

Fleet

Fourteen percent of 2023 reported emissions across all tranches were from vehicle fleet. This includes light and heavy vehicles and covers all travel undertaken in CNGP participant-owned fleet vehicles.

Fleet emissions reduced 14% from Base Year, in part due to the transition to electric vehicles.

EV dashboard reducing government fleet emissions [New Zealand Government Procurement]

Electricity

Five percent of 2023 reported emissions across all tranches were from electricity. This covers activities such as heating and lighting.

Electricity emissions have reduced by 25% (25,336 tCO2-e) across the programme. This reduction is supported by lower emission factors for electricity due to an increased renewable component of the New Zealand electricity grid. Electricity consumption across the programme has also reduced by 10% (80 GWh), reflecting efforts to reduce building energy use.

See further information on Reducing emissions in government office buildings [New Zealand Government Procurement]

Coal boilers

The Government has committed to phasing out the largest and most active coal boilers by the end of 2025. Twenty-three out of 24 projects are on track to be completed by end of 2025.

As of February 2024, 101 of 149 coal boilers in schools have been replaced.

Agriculture

Agriculture is the largest overall emission source at 42% of programme emissions. 97% of this is from the Tranche 3 organisation Pāmu, that manages nearly 360,000 ha of land around New Zealand. Agricultural emissions have dropped 8% since Base Year.

Supply Chain emissions

In addition to the mandatory programme emission sources, CNGP participants are encouraged to measure, report, and set appropriate targets for their Scope 3 value chain emissions. Alternative targets are permitted, reflecting the sometimes-limited influence organisations have over these sources. In 2023, 2,208,086 tCO2-e was reported under this category: 

  1. Fifty-one percent of this was from the state schooling sector, predominantly from staff and student commuting, and purchased goods and services.
  2. Twenty-six percent was from Kāinga Ora, from housing construction and associated activities.
  3. Fifteen percent was from the New Zealand Transport Agency, from state highway infrastructure construction, maintenance and operations, and emergency works. 

This is an important part of the programme where emission reduction initiatives by government can influence the wider economy and support the provision of lower emission goods and services across a wide range of industries. 

Reporting dashboards

Further information